B2B Data
20 min read
What Is Firmographic Data? The Ultimate 2026 Guide to B2B Segmentation

Arezoo Moghadam

B2B marketing, in 2026, is not about reaching everyone but reaching the right one.
Generic messaging and spray-and-pray tactics? They’re dead. Today’s buyers are expecting personalized, relevant communication which speaks directly to their business needs. And the companies that are winning in this landscape have one thing in common: they’ve mastered data-driven marketing through precise B2B segmentation.
But how do you segment audiences that you don’t really understand?
That’s where firmographic data steps in: think of it as the DNA of your ideal customer. It’s the foundational intelligence that tells you which companies are worth pursuing, which accounts deserve priority, and how to craft messages that actually convert.
Whether you’re running your first account-based marketing campaign or scaling an enterprise sales operation, firmographic data is the difference between guessing and knowing who your next customer will be.
Ready to unlock the power of firmographic segmentation? Let’s dive in.
What Is Firmographic Data?
Firmographic information involves the key attributes and characteristics of organizations, such as industry, company size, location, and revenue, which are used in categorizing and segmenting B2B markets. It provides the foundational intelligence that helps businesses identify, target, and prioritize the right accounts for their products or services.
Think of firmographic data as the B2B equivalent of demographic data. While the latter describes individual consumers based on age, gender, and income, firmographics describe businesses and organizations.
Common Firmographic Variables
These are the most-used firmographic data points:
Industry: The vertical or sector a company operates in; examples include SaaS, manufacturing, and healthcare.
Company Size: This ranges from startups to enterprise organizations.
Revenue: Annual revenue or range of revenue that reflects buying power
Location: Geographic headquarters, office locations, or regional presence
Ownership Type: Public, private, non-profit, or government entity
Growth Rate: Scaling signals such as hiring trends, funding rounds, or market momentum
Firmographic vs. Psychographic Data: What’s the Difference?
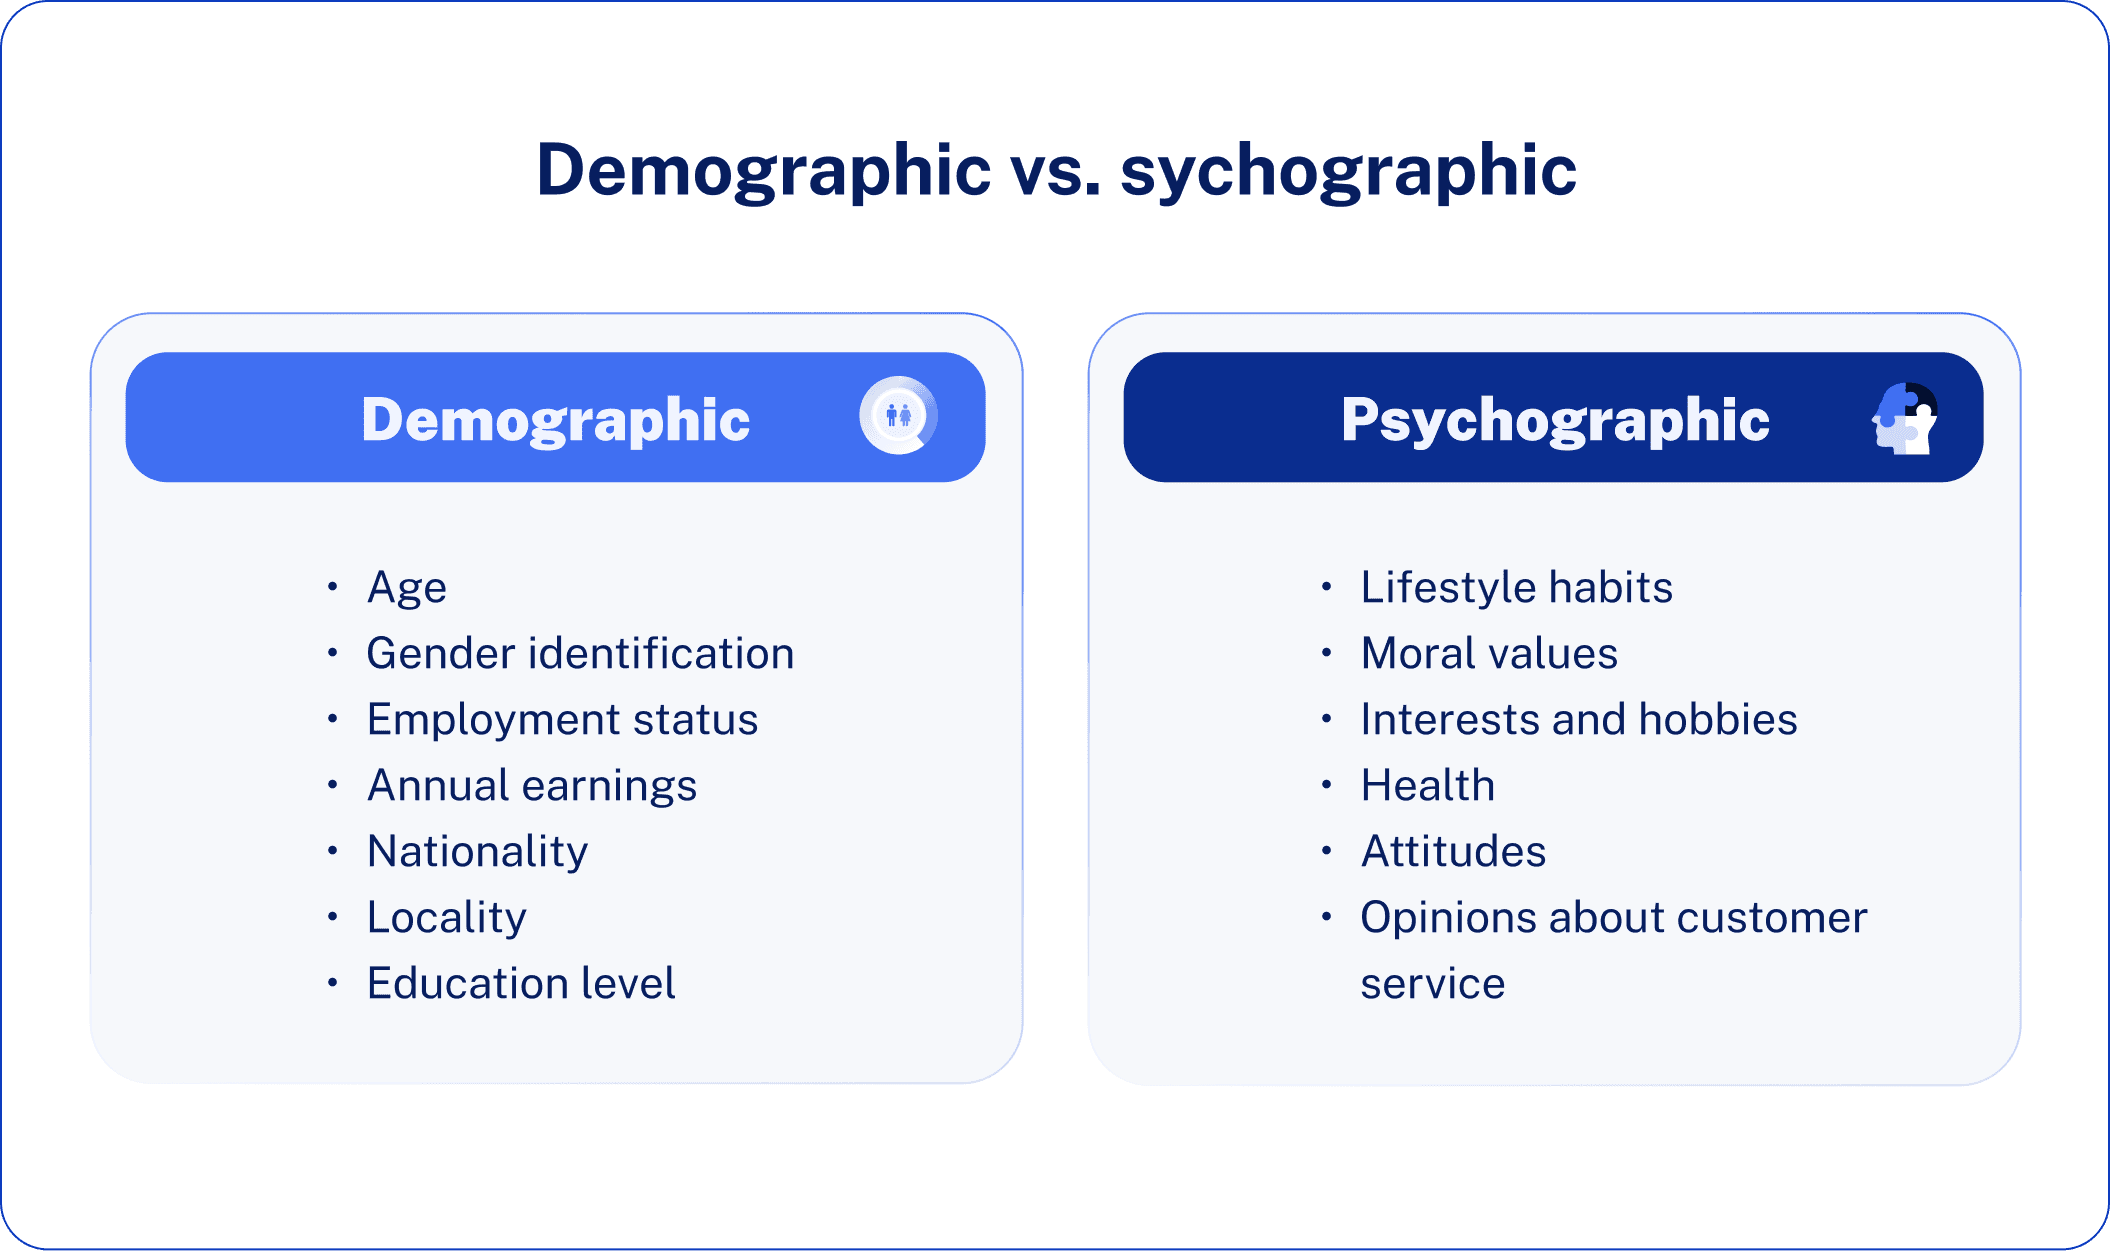
While both data types are useful in B2B marketing, they serve very different purposes: psychographic data reveals the attitudes, values, motivations, and behavioral patterns of decision-makers within organizations, while firmographic data describes tangible, structural characteristics of the companies themselves.
Example:
Psychographic: An innovative company culture, risk-taking leadership style, and use of the latest technology
Firmographic: Mid-market SaaS firm with 200 employees, $50M annual revenue, headquarters in San Francisco
Psychographics tell you why a company might buy and how they make decisions. Firmographics tell you whether they’re the right fit and whether they can afford your solution. In effective B2B segmentation, firmographic data defines your target universe first, while psychographic insight will then refine your messaging and approach.
Why Firmographic Data Is Crucial for B2B Marketers
If you’re still treating all prospects like they are created equal, then you’re just burning through budget, watching qualified leads slip right through your fingers. Firmographic data changes that equation entirely by showing which companies deserve your attention and which ones will waste your time.
Here’s why firmographic data has become non-negotiable for B2B marketing success:
Powers Your Ideal Customer Profile (ICP) Creation
Your Ideal Customer Profile is only as good as the data behind it. Firmographic data provides the foundational attributes that define your most valuable customers: company size, industry, revenue, and location. Companies with a strong ICP realize 68% higher account win rates than their competitors, and firmographics are the building blocks that make this precision possible.
Without firmographic intelligence, you are guessing at who fits your business model. With it, you’re strategically targeting accounts that have the budget, need, and organizational structure to become long-term, high-value customers.
Fuels Targeted Account-Based Marketing (ABM)
The results from account-based marketing strategies show an increase of 171% in average annual contract value and 200% in marketing-sourced revenue. However, ABM will only work when you know precisely which accounts to target, and that’s where firmographic data shines.
Firmographic segmentation lets you identify high-value accounts before investing a single dollar into personalized campaigns. Rather than casting a wide net and hoping, you’re laser-focusing resources on companies matching your proven success patterns. Companies adopting ABM see a 28% increase in overall account engagement and a 25% rise in the conversion rates of marketing-qualified leads into sales-accepted leads.
Enables Precision Campaign Personalization
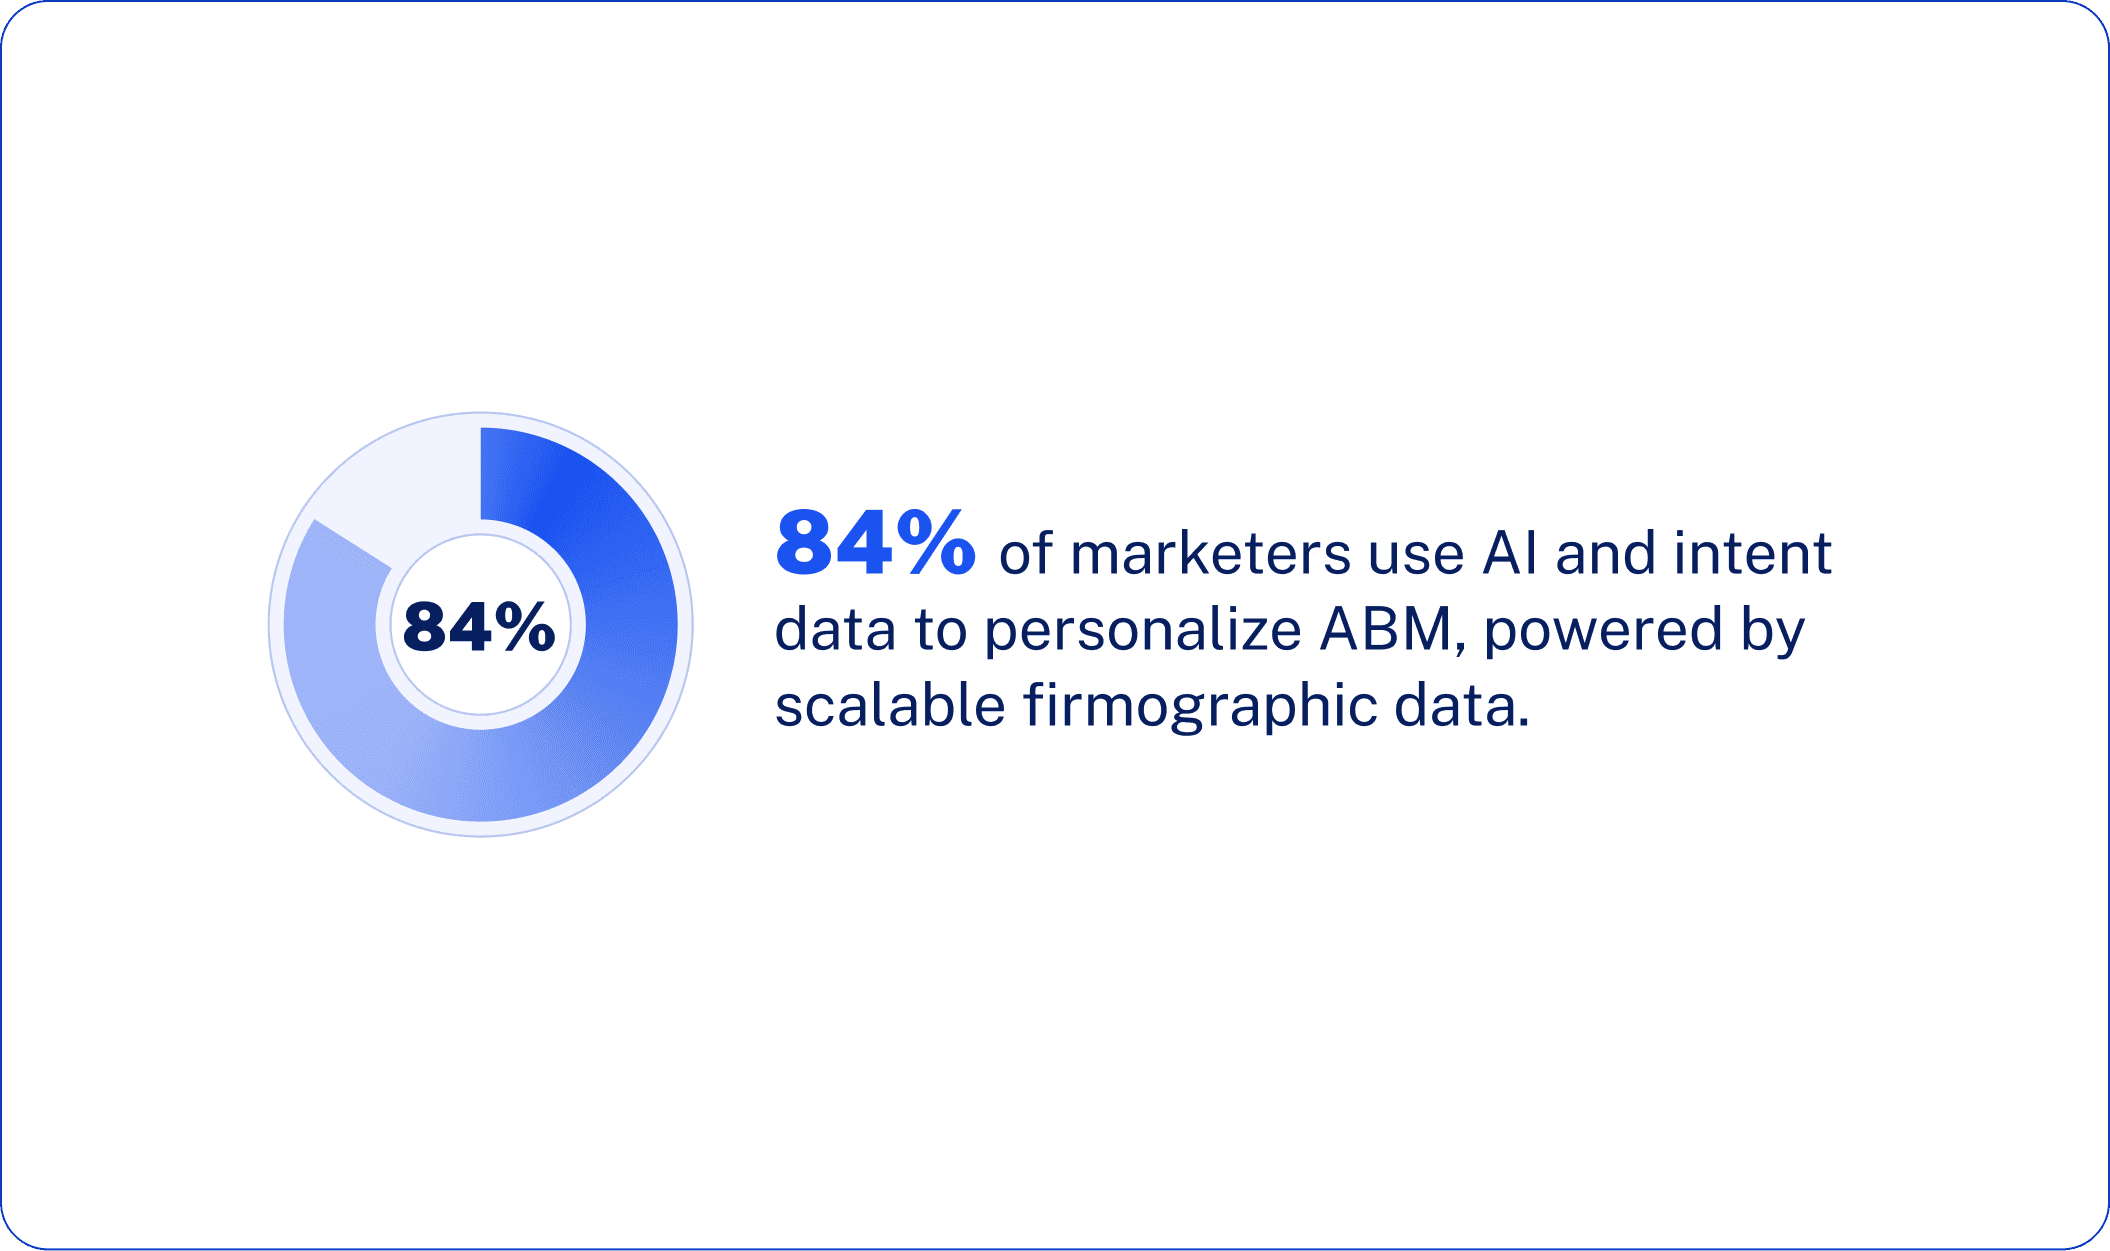
Generic messaging is dead. 84% of marketers report using AI and intent data to increase personalization in their ABM campaigns, and firmographic data is the backbone that enables this personalization to be scaled.
When you know a prospect’s industry, company size, and growth stage, you can tailor everything from ad copy to email sequences to landing page messaging. A 50-person startup has completely different pain points than a 5,000-employee enterprise, firmographic data ensures you’re speaking directly to each segment’s specific needs and challenges.
Improves Lead Scoring Accuracy
Not all leads are created equal, and firmographic data helps you prove that with numbers. You can weight leads based on how well they match your ICP’s firmographic profile to prioritize outreach for accounts that are most likely to convert.
This data-driven lead scoring ensures that sales teams invest time in high-potential opportunities, not in chasing dead prospects. The result is shorter sales cycles, higher conversion rates, and better alignment between marketing and sales on the definition of a qualified lead.
Drives Measurable ROI and Revenue Growth
The bottom line? Firmographic data directly impacts your revenue. Companies with aligned ABM strategies, built on solid firmographic foundations, see a 208% increase in business revenue.
Firmographic data helps you avoid wasting marketing dollars on companies that do not match your business model and therefore maximize the returns. You are not only getting more leads, but better leads that are closing quicker and longer lasting.
In 2026, the difference between companies that thrive and those that struggle often comes down to one thing: knowing exactly who to target and why. Firmographic data gives you that clarity.
Key Firmographic Variables and What They Reveal
Not every firmographic data point is created equal. Knowing which ones matter the most to your business, and what each is actually telling you about a prospect, makes all the difference between precise targeting and educated guessing.
Let’s break down the core firmographic variables and the strategic intelligence each one provides:

Industry
Industry classification refers to the identification of the particular industry vertical in which a company operates, such as SaaS, manufacturing, healthcare, or financial services. This forms a basic understanding of pain points, regulatory requirements, buying cycles, and competitive landscapes.
Different industries have radically different needs, budgets, and decision-making processes. A compliance-heavy industry such as healthcare operates under entirely different constraints from a fast-moving tech startup. Understanding industry segmentation lets you create messaging that speaks directly to sector-specific challenges and tailor product positioning to suit.
Industry data lets you build vertical-specific campaigns, create industry-focused content hubs, and prioritize sectors where your solution has proven product-market fit. This is also important in the case of competitive analysis: knowing which industries your competitors dominate helps you identify underserved markets.
Company Size & Revenue
Company size (typically measured by employee count) and annual revenue indicate an organization’s scale, resources, and complexity. A 50-person startup operates fundamentally differently than a 5,000-employee enterprise.
There is a direct correlation between size and revenue, budget availability, decision-making hierarchy, and buying power. More stakeholders and longer sales cycles Characteristic of larger organizations are that their budgets are larger. Smaller businesses are quicker but could be resource-deficient. Revenue numbers will enable you to estimate the ability of a prospect to afford your solution and is a worthwhile long term account.
Use size and revenue to segment your campaigns by deal size potential, customize pricing conversations, and set appropriate sales resource allocation. It’s also essential for lead scoring a $100M company hitting your website signals a very different opportunity than a $2M company.
Location & Geography
Geographic location encompasses headquarters location, office presence, and regional operations. This data tells you where a company operates, which markets they serve, and what regional factors might influence their decisions.
The location affects not only time zone issues and language choice but also regulatory compliance, taxation, and competition. Firms in the GDPR controlled area do not have the same data privacy issues as other markets. The economic conditions in a region, the maturity of a market and cultural business practices are all critical factors in purchasing behaviour.
Geographic data powers regional campaign targeting, helps you determine optimal expansion markets, and enables localized messaging. It’s also practical—knowing a prospect’s location helps sales teams schedule meetings at reasonable hours and plan in-person visits strategically.
Ownership Type
Ownership structure indicates whether a company is publicly traded, privately held, venture-backed, bootstrapped, non-profit, or government-owned. Every structure has its own financial burdens, reporting needs and decision-making models.
Public companies are forced to face quarterly earnings pressure and shareholder interests which usually force them to make more conservative, ROI-oriented purchases. The private companies might be more flexible though possibly may have a tight budget. Venture-backed startups might prioritize growth over profitability and make faster decisions. Non-profits and government entities have entirely different procurement processes and approval requirements.
Ownership type helps you anticipate budget cycles, customize ROI messaging, and adjust your sales approach. Public companies may need board approval for large purchases, while startups might move from demo to signature in days. Tailor your sales cycle expectations and messaging accordingly.
Growth Rate & Employee Count Trends
Growth indicators, hiring velocity, funding rounds, market expansion, revenue growth, signal a company’s trajectory, momentum, and current priorities. A company aggressively hiring across departments is in a very different stage than one with flat headcount.
Growth signals both opportunity and urgency. Growing companies have scaling challenges, which present urgent requirements of solutions. They are currently developing infrastructure, increasing the number of headcount, and investing strategically. On the other hand, firms whose growth is either stagnant or falling may be cost-cutting and they are more difficult to sell to irrespective of a fit. Growth rate is one of the strongest predictors of purchasing power and willingness to invest in new solutions.
Target high-growth companies for expansion-focused messaging and fast-scaling use cases. Use hiring trends to trigger timely outreach if a company just posted 10 sales positions, they likely need sales enablement tools. Growth data also helps prioritize accounts likely to expand their investment with you over time.
Firmographic vs Demographic vs Technographic Data
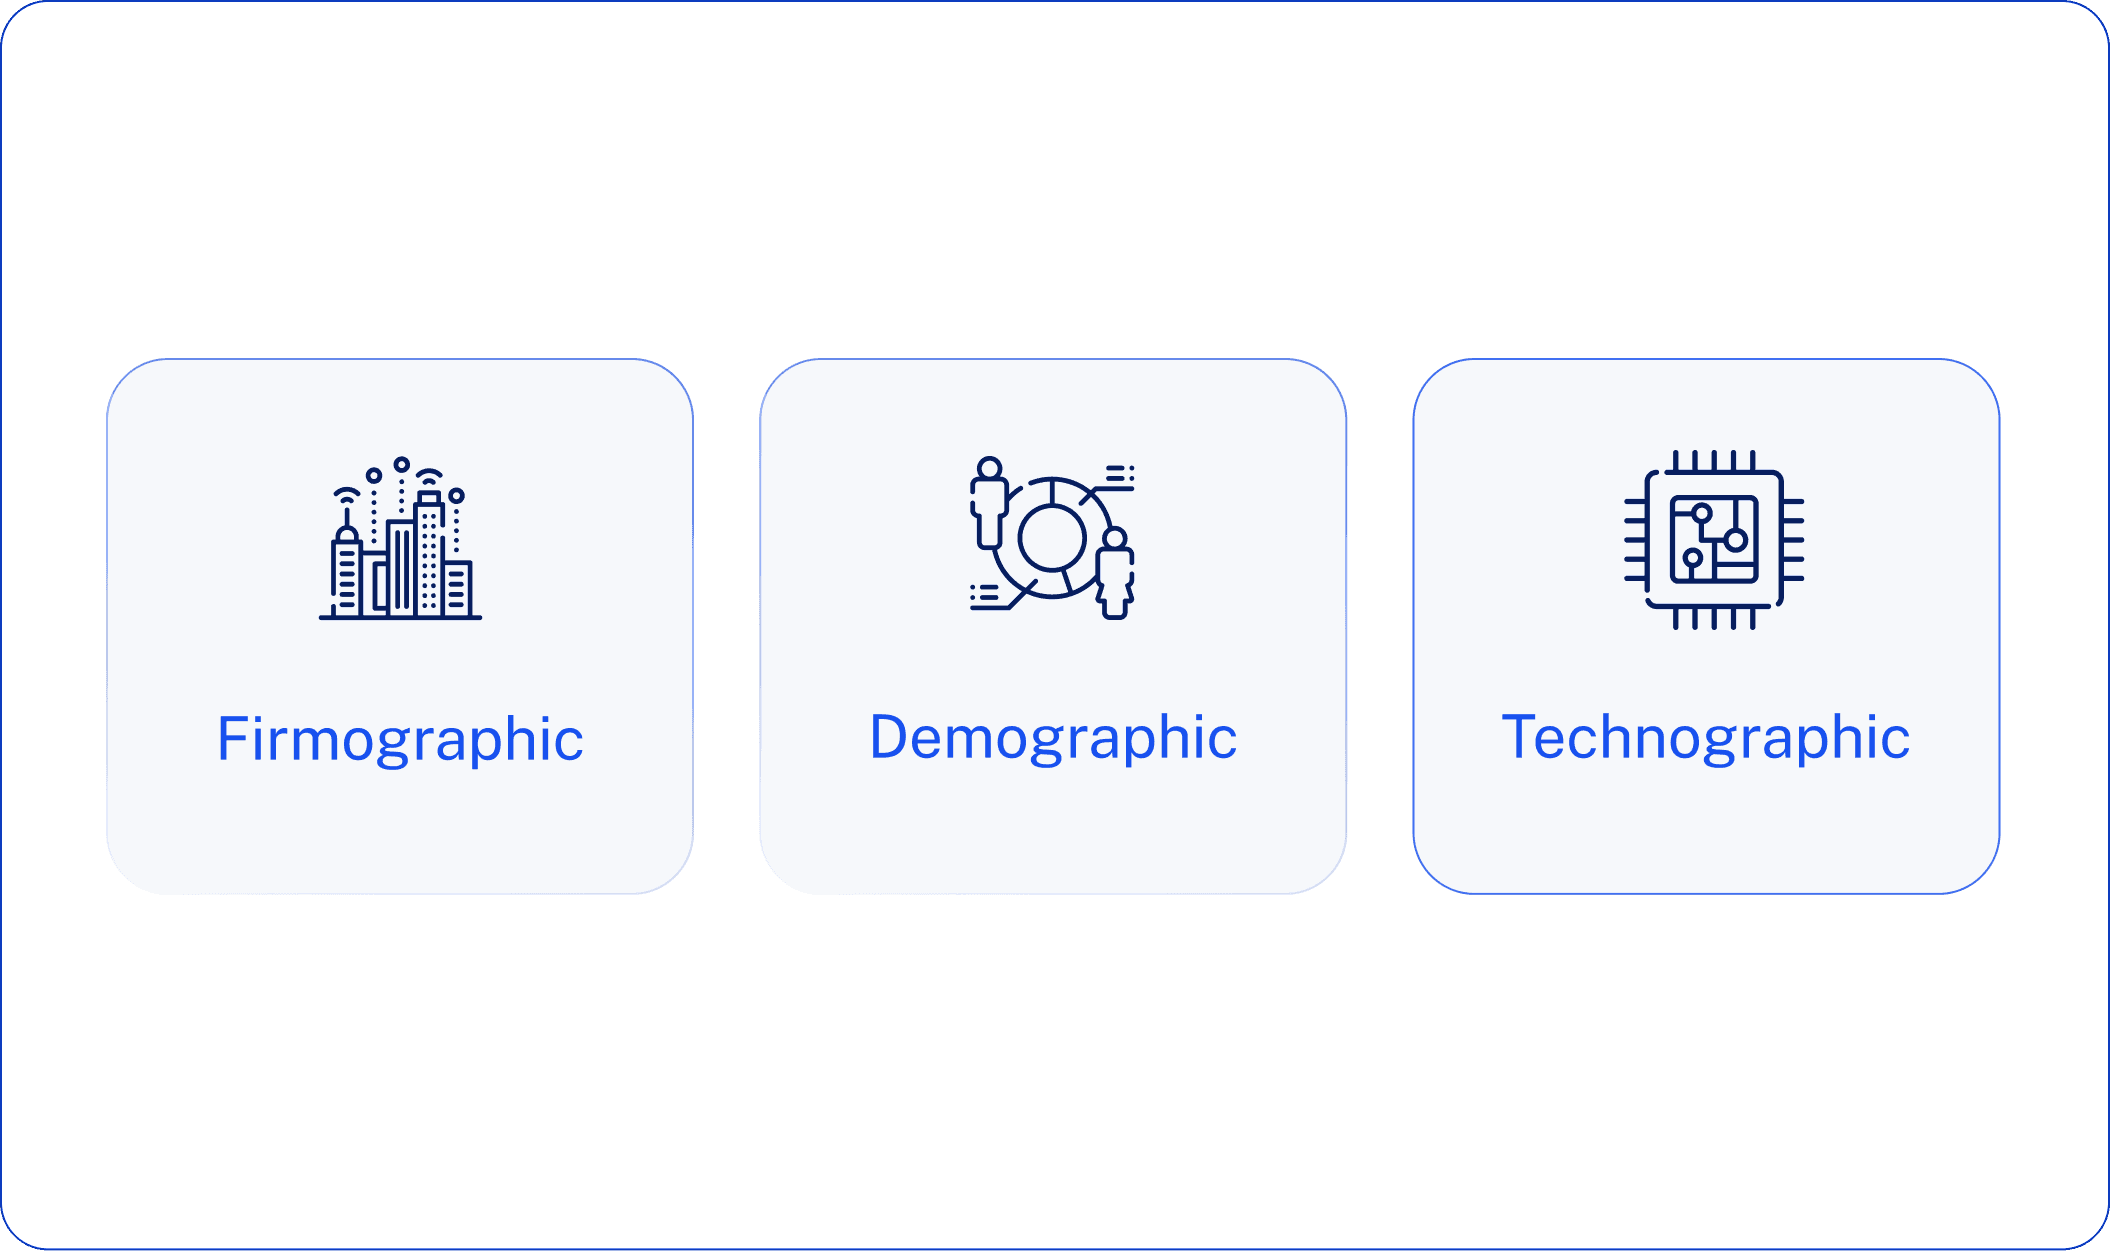
Understanding the distinctions between firmographic, demographic, and technographic data is essential for building effective B2B marketing strategies. While these data types often work together, each serves a unique purpose and answers different questions about your target audience.
Data Type | Focus | Used In | Example |
Firmographic | Company-level attributes | B2B segmentation, account-based marketing | Industry, company size, revenue, location, ownership type |
Demographic | Individual-level characteristics | B2C targeting, buyer persona development | Age, gender, income, education, job title |
Technographic | Technology usage patterns | SaaS marketing, tech stack analysis | CRM tools, ERP systems, cloud platforms, marketing automation |
Firmographic Data
Firmographic data focuses on company-level attributes and organizational characteristics. It’s the backbone of B2B market segmentation and account-based marketing strategies.
Key Data Points: Industry vertical, company size (employee count), annual revenue, geographic location, ownership structure (public/private), years in business, growth rate
What It Tells You: Whether a company fits your ideal customer profile, has the budget and need for your solution, and represents a high-value opportunity
Example: A mid-market SaaS company with 250 employees, $75M annual revenue, operating in the healthcare industry, headquartered in Boston, privately held with 40% year-over-year growth.
Demographic Data
Demographic data is a set of personal characteristics and traits of individuals, which is mostly utilized in the context of B2C consumer targeting and the personal profile of buyers.
Major Data Items: age, sex, level of income earned, education level, marital status, occupation, household number, ethnicity.
What It Tells You: Who the individual person is, what stage they are in their life, what their personal situation is and what their probable consumer actions are.
Examples: a 42 year old woman high profile marketing director and has master degree, is married with 2 children and has annual earnings of 135K and resides in suburban Chicago.
Technographic Data
Technographic data is available on the technology infrastructure and patterns of software use, required in SaaS marketing as well as competitive intelligence.
Important Data: Software stack now, CRM platform, marketing automation tools, cloud infrastructure, programming languages, integration abilities, technology expenditure.
What It Tells You: What technologies a company currently employs, the level of its digital maturity, and what it can integrate with and how easy it can replace the technology.
Sample: A firm with Salesforce CRM, HubSpot marketing automation, AWS cloud provider, Slack communication and Adobe Creative Suite design tools.
How These Data Types Work Together
In B2B marketing, the most powerful strategies synthesize all three data types in a cohesive manner. Firmographics identify which companies are the best fit and potentially most valuable, while demographics help understand the individual decision-makers within those companies to create personalized outreach. Technographics outline the technology context and exact pain points that make your solution relevant now.
For instance, you may want to target a mid-market fintech company with 500 employees and $100M in revenue, firmographic. You’ll reach out to a 38-year-old VP of Engineering who has 15 years of experience, demographic, at a company that uses outdated legacy systems incompatible with modern APIs, technographic. Each layer adds more precision and relevance to your targeting strategy.
Firmographic data acts as a bridge between broad audience insight and precision targeting. If demographic data is about the people and technographic data about technologies in use, firmographic data answers the most vital question in B2B: Is this company worth pursuing? It’s the foundation that determines whether you’re investing your sales and marketing resources in accounts with genuine potential or wasting time on prospects that will never convert.
In the competitive B2B world, this is not just best practice; it forms the baseline required for effective segmentation and account targeting.
How to Collect and Enrich Firmographic Data
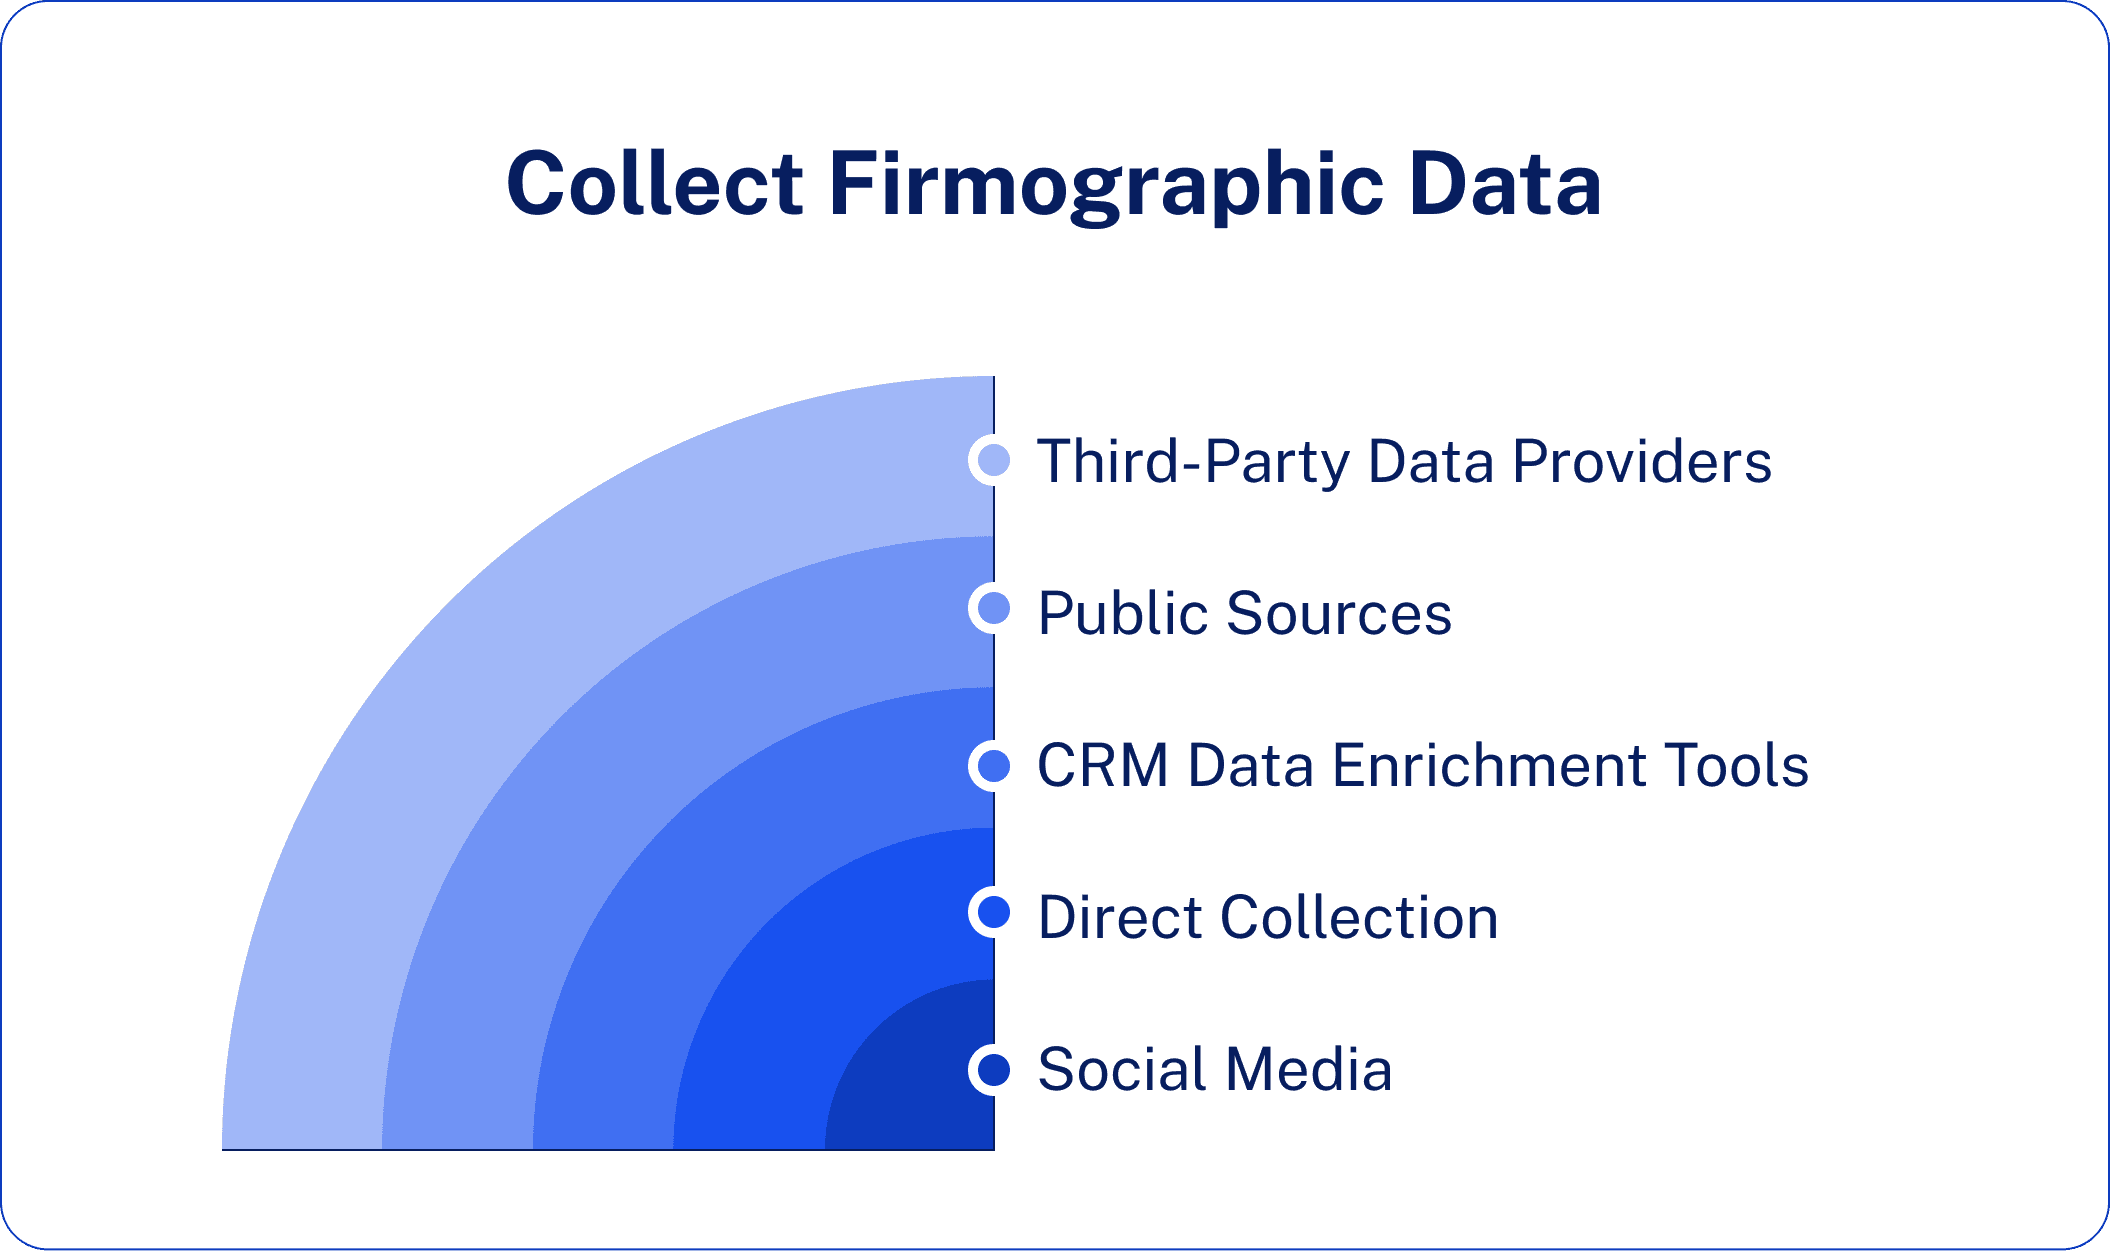
There are five main ways to source firmographic data: third-party data providers, company websites and public records, CRM enrichment tools, surveys and forms, and social media platforms like LinkedIn. Each method has its unique advantages, based on your budget, scale, and data quality requirements.
The key to a reliable firmographic database is not about which one to pick among the methods, but how you combine them to ensure accuracy, completeness, and freshness.
Method 1: Third-Party Data Providers
Third-party data providers are specialized companies that aggregate, verify, and sell firmographic data at scale. They continuously gather information from thousands of sources, cleaning and standardizing the information, then packaging it into searchable databases available by subscription or API integrations.
Examples include AI Ark, ZoomInfo, Clearbit, Demandbase, Cognism, Apollo.io, and UpLead.
How They Work: These providers combine web scraping with publicly available information, user-submitted data, and proprietary algorithms to compile complete profiles of companies. Most offer various ways of filtering your search, list building tools, and real-time data enrichment.

Best For: Large prospecting needs, higher frequency of update requirements, and more budget for premium tools. It helps sales teams perform high-volume outbound campaigns or marketing teams create large account-based marketing programs.
Method 2: Public Sources & Company Websites
Data on firms obtained publicly is either free or less expensive, yet requires more manual labor and time to assemble.
Primary Sources:
Annual Reports: Public firms lay out all financial information, number of employees, strategic plans, and positioning.
Press Releases: Company news regarding funding, acquisitions, expansions, changes in leadership and product releases.
SEC Filings: 10-K and 10-Q reports include certified revenue, organizational structure and riskiness of the public companies.
Company Websites: About pages, career section and investor relations pages discloses the location, size estimations and growth indications.
Free vs. Paid Sources: Most data on public companies is available for free via SEC.gov, company sites, and news organizations. Subscription-based resources such as business databases, industry reports, and upgraded news subscriptions offer more in-depth coverage for private company information.
Data Accuracy Considerations: Public sources usually have high accuracy since companies are obliged by law to report truthfully in official filings. However, this data is often outdated (as annual reports are only published once a year), and information concerning private companies is often limited or self-reported without verification.
Method 3: CRM Data Enrichment Tools
Data enrichment within CRM automatically completes missing information about contacts and accounts already present within your database. The need to manually search each company is eliminated because APIs are directly utilized to enrich information in both real-time and batch processes.
How Enrichment Works: As soon as a new lead is added to a CRM system, enrichment services employ variables such as company domain information, email addresses, and company names to search their databases and automatically fill out fields such as industry type, company size, revenue, and geographic regions, whether immediately at the time of record creation or on a designated timetable.
Integration Benefits:
Eliminates human intervention used in manual entry.
This guarantees consistency in your database.
Updates its records every time there is an automatic updating.
Facilitates better lead-scoring outcomes including full firmographics.
Enhances Segmentation Advantage which supports Directional campaigns.
Top Tools to Consider: AI Ark Enrichment API, Clearbit Enrichment, ZoomInfo Operations, HubSpot Data Enrichment, Demandbase Data Cloud, and Cognism Enrich. These generally offer native integration with popular CRM solutions like Salesforce, HubSpot, and Microsoft Dynamics.
Method 4: Direct Collection (Forms & Surveys)
To gain access to precise, first-party information about prospects directly from them themselves, one can use forms, surveys, and conversations to collect prospect information.
Progressive Profiling: Rather than asking for too much information on lead-gathering pages, it is possible to continue gathering information about a lead on multiple touches. For example, you could start by asking for name, email, and company on the initial page. Then on subsequent touches, you could ask about company size and industry.
What to Ask:
Company name and website (for verification and enrichment)
Industry or Vertical
The company size (ranges of employees work better than specific numbers)
Job title or department
The main business issues/challenges & goals
What NOT to Ask:
Omit asking about easily enriched information such as revenue and geolocation on initial signup screens
Don’t ask for sensitive information, such as budget numbers or internal metrics
Omit questions about things you don’t feel comfortable talking about, and which aren’t relevant to what you have to offer
Never request more than 5-7 pieces of information on one single form, each added field reduces your conversion rate
The golden rule: Only request information that you can’t easily access elsewhere and is important to your qualification or personalization.
Method 5: Social Media & LinkedIn
Professional networking is a goldmine source of firmographic information, particularly concerning company structure, growth indicators, and decision-maker identification.
Company Pages: The company pages on LinkedIn show information such as staff strength in numbers, headquarters, industry type, business description, and news feeds. You can keep abreast with employees hired, office expansions, and other developments.
LinkedIn Sales Navigator: This is a paid tool on which you can search for companies using multiple factors such as industry, company size, revenue, growth rate, and more. Using this tool, you can build targeted lists, receive job change and company news alerts, and identify decision-makers on accounts you are targeting.
Data Limitations: The dataset obtained from LinkedIn has some limitations. The numbers of employees are estimates using personal profiles, which are not actual headcount numbers. Not all private corporations keep their pages up to date. The figures for revenue are not directly viewable. Finally, aggressive scraping goes against LinkedIn’s terms of service.
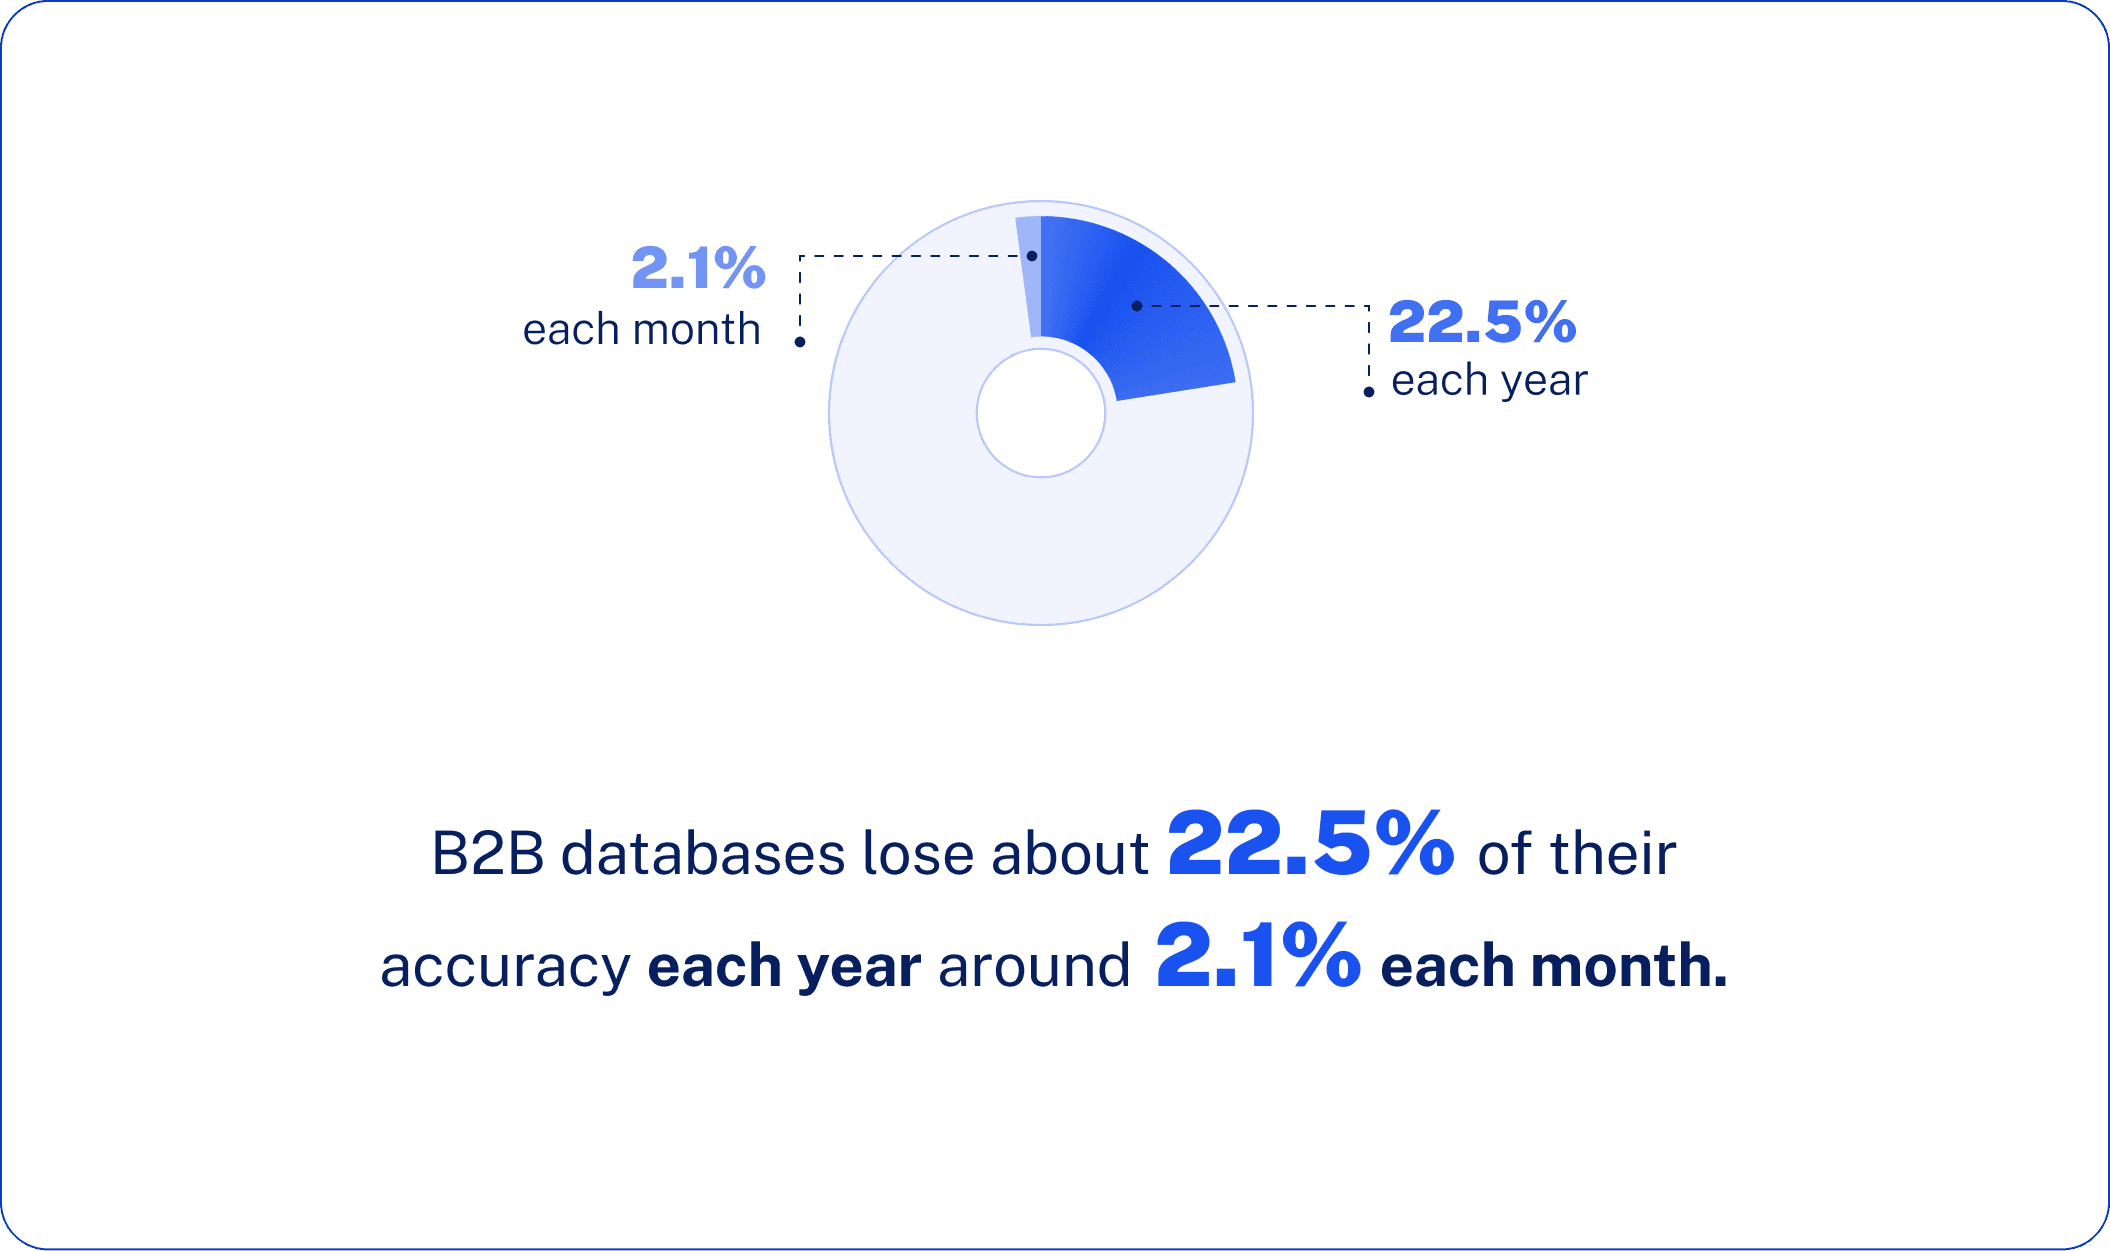
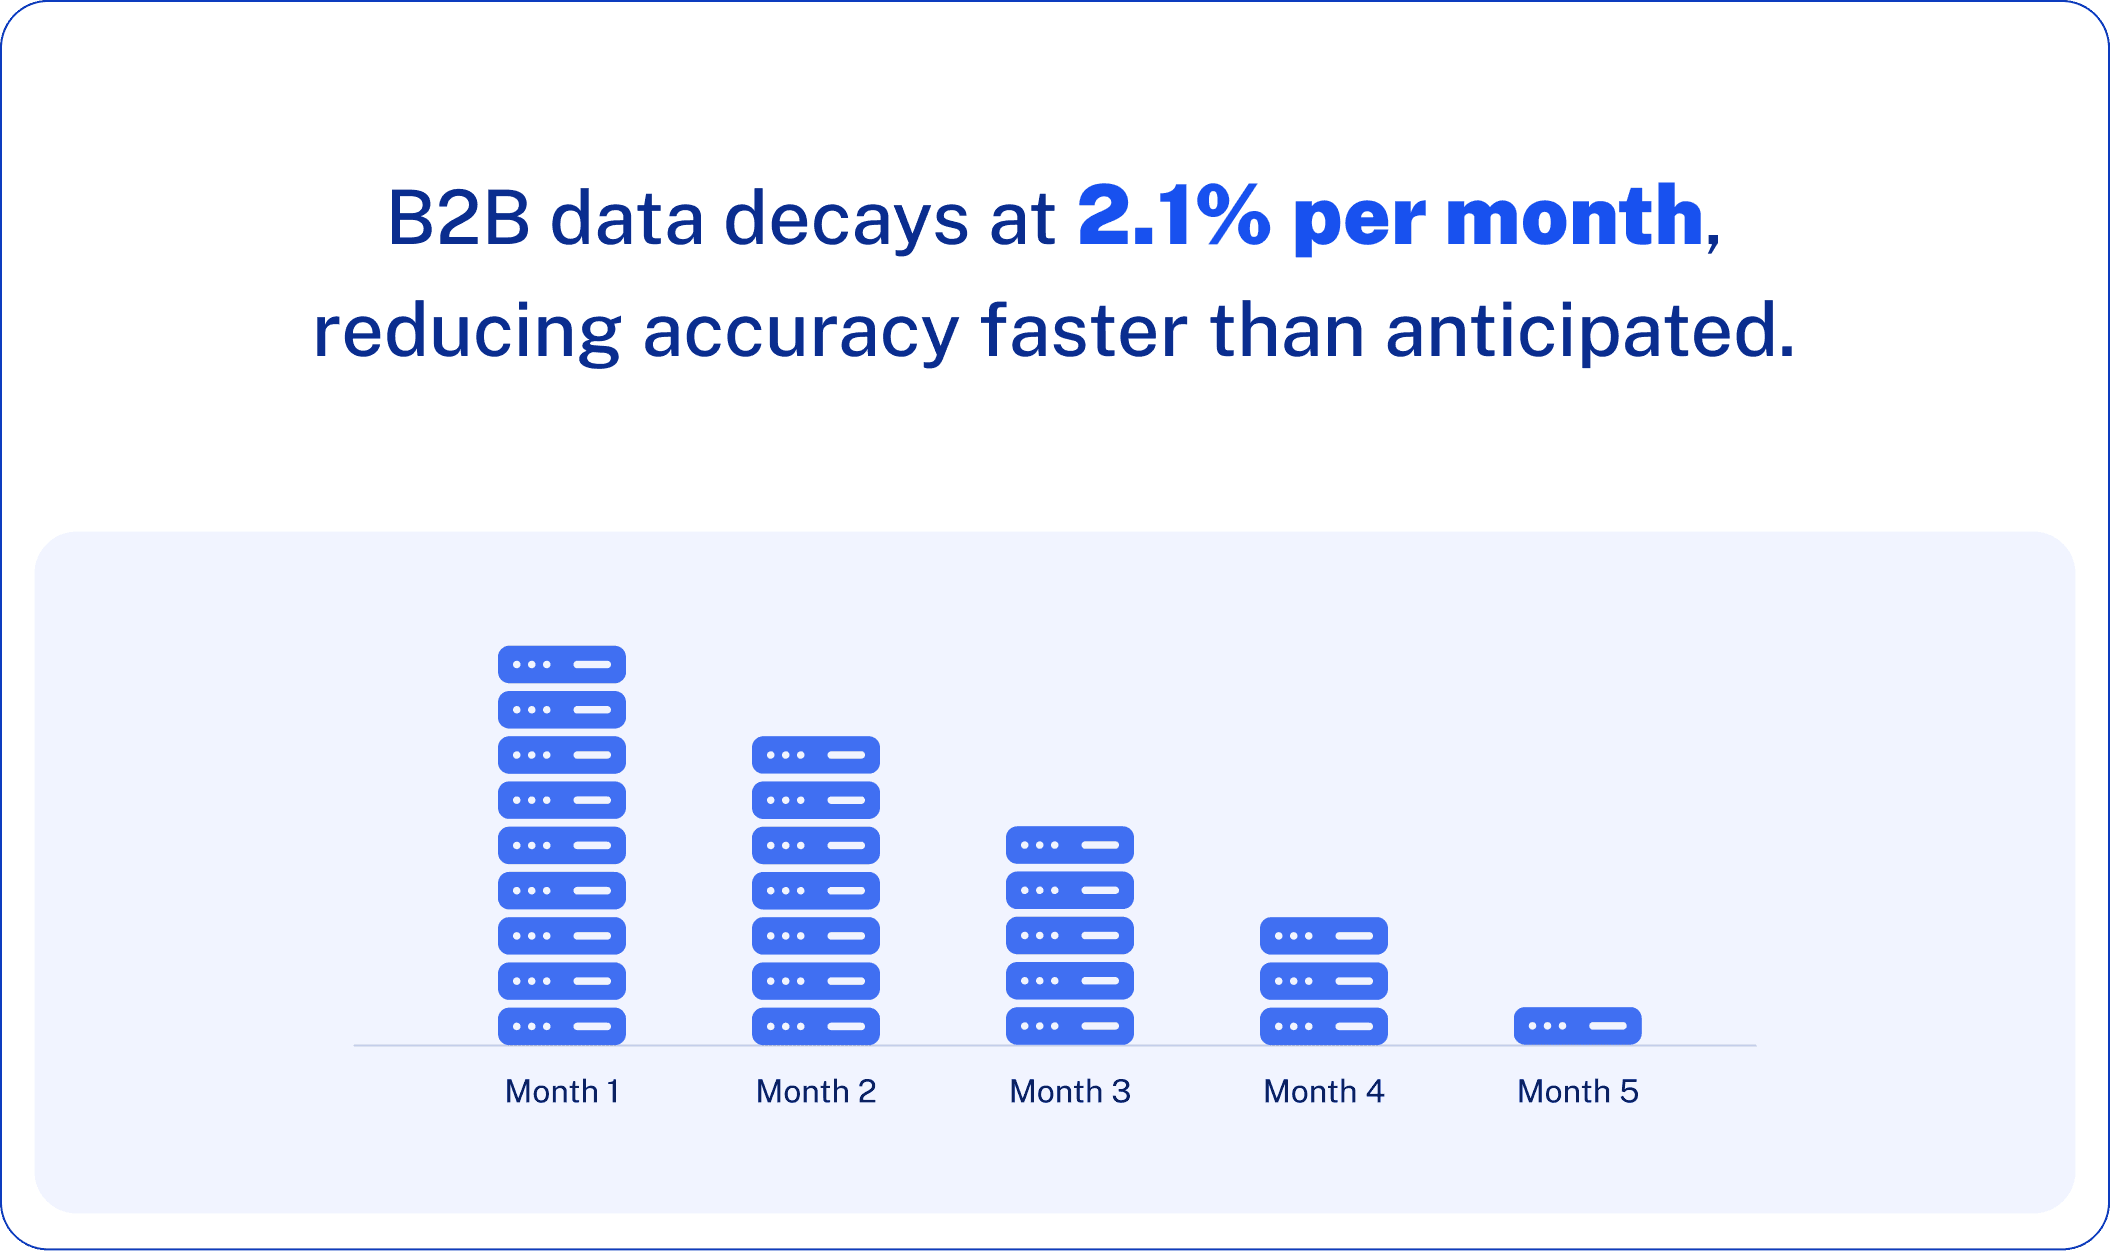
Data Quality Alert: It is imperative to authenticate company information obtained from more than one source. The rate at which B2B databases experience degradation is approximately 22.5% on a compounded annual basis, due to factors such as business expansion, relocation, change in business type, or business failure. An average degradation rate of 2.1% on a compounded monthly basis is experienced by B2B information.
How to Use Firmographic Data for B2B Segmentation
Now that you have gathered firmographic information, it is time to put it into play. This is how you can use firmographic intelligence to enhance your B2B segmentation and optimize your marketing results:
Building Ideal Customer Profiles (ICPs)
Firmographic information is actually the foundation upon which your ICP is built, because it helps you identify which accounts to actually pursue. To identify your ICP, you can analyze your most successful accounts that you already have, and then look at similar characteristics such as type of business, business size, revenue range, geography, and stage of growth.
Segmenting Leads by Company Size, Revenue, or Industry
Not all leads are alike. It is necessary to use firmographic segmentation to identify differences that correspond to how you can sell. Larger enterprises with 1,000+ employees require different communication, a longer sales cycle, and engagement with executives compared to mid-market organizations with 100-500 employees. Another segment is revenue to identify suited customers according to tiered pricing, and industry to discuss issues like compliance, competition, and operations unique to each industry.
Tailoring Campaigns to Industry Pain Points
Generic messaging is not very effective in B2B marketing. Firmographics allow you to tailor your marketing to specific industries and directly address those industry pain points. A company within the healthcare industry understands your expertise with HIPAA regulations and how you can safeguard patient information. A manufacturing business is concerned about improving supply chain management and maximizing productivity. A financial services business wants to know about regulatory issues and fraud protection.
Prioritizing Accounts in ABM Programs
Account-based marketing thrives and dies on being focused on the right accounts. Using firmographic information enables you to segment accounts into tiers based on their relevance and value. Tier 1 can comprise high-revenue enterprises classified within your desired industries with attractive growth indicators. Tier 2 encompasses accounts that fit well but have less value. Tier 3 comprises acceptable accounts to which less aggressive engagement is required. The tiered approach ensures that your marketing and sales initiatives reach accounts with maximum convertibility and value.
The Firmographic Segmentation Funnel
Think about company-specific information like a sequence of filters where you narrow down your total possible market to your ideal customers:

Stage 1 – Total Market: All businesses within your targeted geographic area
Stage 2 – Industry Filter: Industries such as Saas, Healthcare, Finance, etc.
Stage 3 – Size Filter: Employers within your range of ideal employees and revenue figures
Stage 4 – Growth Filter: Enterprises displaying positive growth indicators or funding activity
Stage 5 – Qualified Accounts: High-fit prospects meeting your ICP qualifications
Stage 6 – Priority Targets: Top-tier accounts for focused ABM engagement
Both filters eliminate leads that do not meet your specifications, leaving you with a shortlist of high-quality accounts deserving your best sales and marketing attention. This methodical strategy converts general market familiarity into targeted precision that generates maximum return on investment.
Tools and Platforms for Firmographic Data Enrichment
The correct tooling can completely revolutionize how you gather, enrich, and use your firmographic information. Below are some of the best platforms available that allow B2B marketers to gather accurate and scalable firmographic information:
AI Ark – An AI-driven B2B data platform with new company-level information available every 9-30 days, providing precise audience segmentation.
Clearbit – Add company information to your leads and contacts automatically, enriched with real-time firmographics directly into your CRM.
ZoomInfo – A complete B2B intelligence platform offering vast firmographic information about company size, revenue, industry, and technology usage.
Apollo.io – This is a prospecting and enrichment tool that uses both firmographic information and email sequencing functionality within one system.
LinkedIn Sales Navigator – A very high-quality screening process but done manually with access to company information available on LinkedIn.
Firmographic Data Platform Comparison
Platform | Best For | Key Strength | Data Freshness | Pricing Model |
AI Ark | Teams needing fresh, accurate B2B contact & company data | AI-powered search, look-alikes, and precise B2B segmentation | Excellent (30 days) | Usage-based credits + custom plans |
Clearbit | Sales ops needing B2B enrichment & visitor intent | CRM/API integration + rich B2B data & segmentation | Good (Real-time) | Usage/credit-based + custom enterprise plans |
ZoomInfo | Enterprise sales teams | Massive database with direct dials and mobile numbers | Good (near real-time) | Annual subscription + custom quotes |
Apollo.io | All-in-one prospecting | Large data + built-in engagement platform | Good (frequent updates) | Freemium + subscription |
LinkedIn Sales Navigator | Relationship-based sales & B2B prospecting | Access to LinkedIn’s verified network | Excellent (near-real-time lead) | Monthly subscription |
Choosing the Right Platform
Your ideal firmographic data platform depends on several factors:
For startups and small teams: Apollo.io and AI Ark provide a more affordable entry point with strong data quality and a user-friendly interface.
For enterprise organizations: ZoomInfo provides the scale, depth, and integration capabilities that large sales teams need.
For enrichment in real time: Clearbit is great for automatically enriching leads as they come in so that your CRM never goes stale.
AI-driven precision: AI Ark uses the latest data, intelligently segmented with the power of artificial intelligence.
To build relationships: LinkedIn Sales Navigator provides unparalleled visibility into company structures and decision-maker networks.
In most scenarios, it is the combination of different tools that delivers the best results. For instance, AI Ark, an all-in-one workspace for extensive prospecting, can be complemented with LinkedIn Sales Navigator for relationship intelligence or Clearbit for real-time enrichment.
Common Challenges with Firmographic Data And How to Overcome Them
Even with the best firmographic data at your fingertips, common pitfalls can derail your segmentation efforts. Here’s what goes wrong and how to fix it:
Challenge #1: Outdated Data Killing Your Campaigns
The Problem: You’re targeting a VP who left six months ago. The company moved headquarters. Revenue numbers are from two years ago. With B2B data decaying at 2.1% monthly, your meticulously built database becomes obsolete faster than you think.
The Solution:
Schedule quarterly data refresh cycles, not annually
Implement automated enrichment tools that update records in real-time.
Set up alerts related to major company changes: funding, acquisitions, change of leadership
Remove or flag records not verified in 12+ months
Challenge #2: Ignoring Small and Mid-Sized Businesses
The Problem: Everyone chases enterprise accounts, yet SMBs often convert faster, have shorter sales cycles, and can become your most loyal customers. You’re leaving money on the table by focusing only on Fortune 500 firmographics.
The Solution:
Create different ICPs for enterprise, mid-market, and SMB segments
Build customized messaging and pricing for each segment
Note that while SMBs have smaller budgets, they have a high growth potential.
Don’t apply enterprise qualification criteria to mid-market opportunities
Challenge #3: Generic Segmentation That Misses the Mark
The Problem: Segmenting based on “industry” and “company size” is lazy targeting. A 500-person fintech startup has completely different needs than a 500-person traditional bank, even though they look identical on paper.
The Solution:
Layer multiple firmographic criteria: industry + size + growth stage + tech stack
Add behavioral and intent data to firmographic segments
Create micro-segments around specific pain points, not general categories.
Test and refine segments based on real conversion data, not assumptions.
Challenge #4: Misaligned Data and Buyer Journey
Problem: You use the same firmographic criteria for top-of-funnel awareness and bottom-of-funnel purchasing decisions. A company’s size matters differently at different stages; what qualifies a lead isn’t what closes a deal.
The Solution:
Awareness Stage: Broader firmographic filters to maximize reach
Consideration Stage: Tighter criteria focusing on budget and authority
Decision Stage: Strictest ICP match with verified buying signals
Adjust the weight of lead scoring as prospects move through the funnel.
Challenge #5: Single-Source Data Syndrome
The Problem: Relying on one data provider means inheriting their gaps, biases, and inaccuracies. No single source has perfect coverage across all industries, regions, and company sizes.
The Solution:
Use multi-source enrichment combining 2-3 data providers
Cross-reference critical data points (revenue, headcount) across sources
Supplement third-party data with first-party collection and public records
Build a “truth hierarchy”, which source do you trust most for each data type?
The Golden Rules for Firmographic Success
Fresh beats comprehensive. Better to have correct data on 10,000 companies than to have old data on 100,000.
Context trumps criteria. A fast-growing 50-person company may be a better fit than a stagnant 5,000-person enterprise.
Automation loses to validation. Always manually validate high-value accounts before running expensive ABM campaigns.
Keep in mind: firmographic data is a tool, not a strategy. The companies crushing it with firmographics aren’t just collecting better data, they’re using it smarter.
The Future of Firmographic Data in 2026 and Beyond
Firmographic data doesn’t stand still. As B2B marketing continues to evolve, so too do the tools and strategies for leveraging company intelligence. Here’s what’s shaping the future:
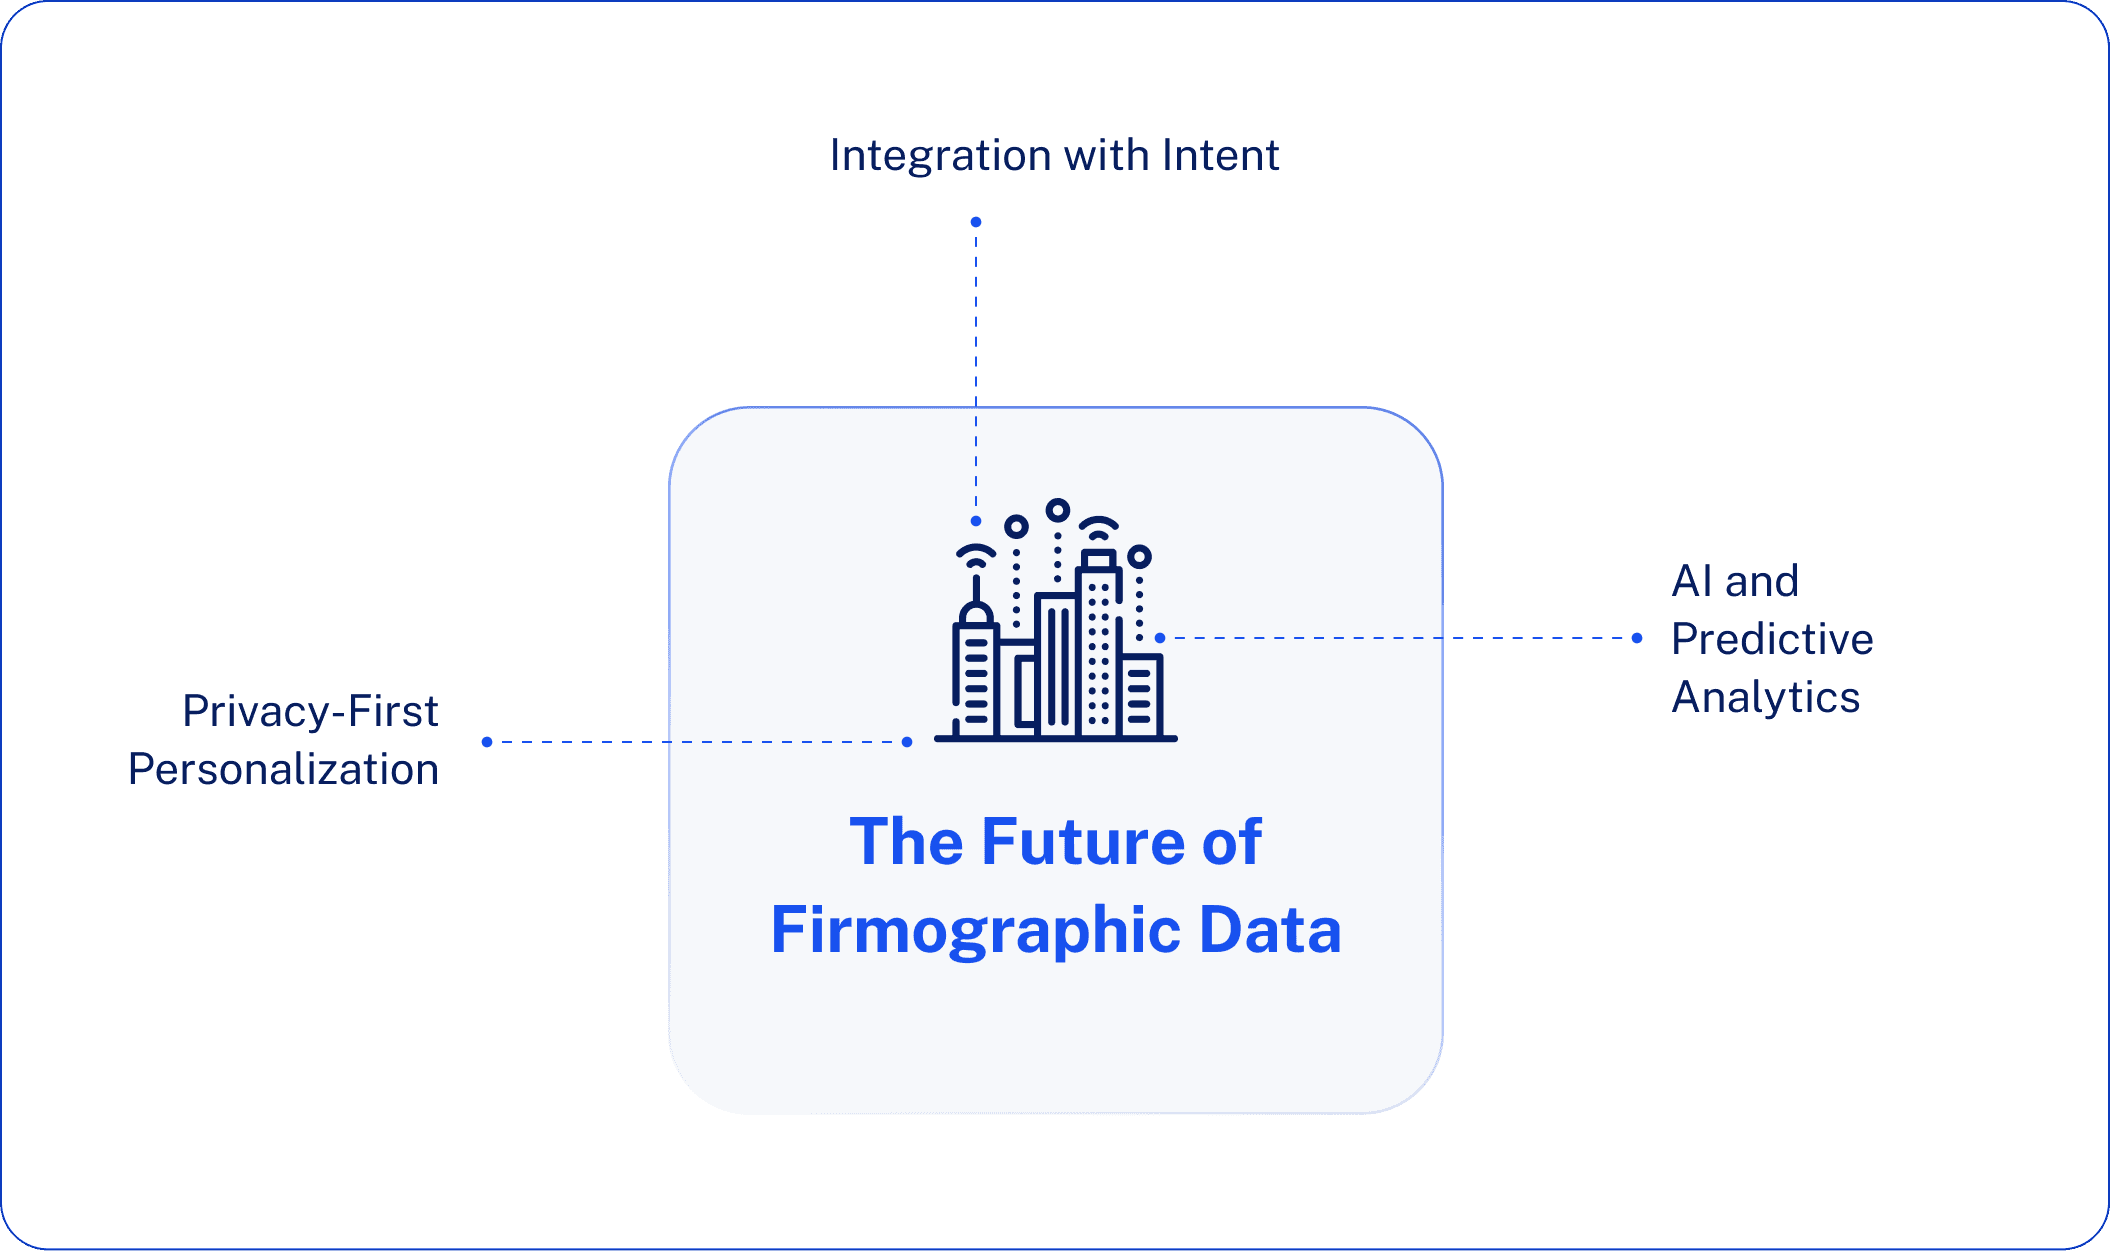
AI and Predictive Analytics in Firmographic Modeling
Traditional firmographic segmentation tells you what a company looks like. AI-powered predictive analytics tell you what they’ll do next. Machine learning models have moved beyond analyzing historical firmographic patterns to predict which accounts are most likely to convert, expand, or churn. Instead of manually scoring leads on static criteria, AI identifies hidden correlations, such as how companies in particular revenue ranges and with specific growth trajectories convert at 3x higher rates. Smarter targeting, less guesswork.
Integration with Intent and Technographic Data
Firmographics alone answer “who” but miss “when” and “why.” The future is converging firmographic, intent, and technographic data into unified account profiles. You’ll know not just that a prospect is a $50M SaaS company, but that they’re actively researching your solution category, their current tech stack is incompatible with competitors, and they just secured Series B funding. This three-dimensional view enables precision timing and hyper-relevant messaging that dramatically improves conversion rates.
Privacy-First Personalization
Consent and transparency are the priorities of the future in firmographic data, with regulations on data privacy tightening all over the world. Smart marketers are moving toward enrichment that is privacy-compliant, relying on publicly available business information instead of invasive tracking. Collection of first-party firmographic data through progressive profiling is becoming the gold standard, supplemented by verified third-party sources who respect the laws on data protection. The winners will be those who can deliver personalization without sacrificing trust.
The bottom line? Firmographic data is getting smarter, more integrated, and more respectful of privacy, making it more powerful than ever for B2B marketers who adapt.
Putting Firmographic Data to Work: Your Next Steps
Firmographic data is the backbone of modern B2B segmentation. It’s what separates companies that waste budget on unqualified leads from those that consistently hit their revenue targets with precision targeting.
You now have the blueprint: what firmographic data is, how to collect it, and how to use it in order to build ICPs, segment audiences, and prioritize high-value accounts. The question isn’t whether firmographic data works; it’s whether you’re ready to put it to work.
The smartest B2B teams aren’t guessing who their ideal customers are. They know. And they use that knowledge to dominate their markets.
Ready to change the game in B2B segmentation using AI-powered firmographic intelligence?
Discover how AI Ark delivers fresh, accurate data that drives real results. Start your free trial today and see the difference precision targeting makes.
FAQs About Firmographic Data
What is firmographic data and why is it important in B2B marketing?
Firmographic data is a set of company-level attributes, such as industry, size, revenue, location, and growth rate, used to segment and understand B2B audiences.
It matters because it helps marketers to identify high-fit accounts, build accurate ICPs, run personalized campaigns, and prioritize leads most likely to convert. Firmographic insights eliminate guesswork and make sure every marketing action targets companies with real buying potential.
What is the difference between demographic, technographic, and firmographic data?
Demographic data describes people: age, job title, and income. Technographic data describes a company’s technology stack: CRM, cloud tools, automation platforms. Firmographic data describes the company itself: industry, size, revenue, location.
Combined, these three data types create a complete picture: firmographics identify the right companies, demographics identify the decision-makers, and technographics outline their technology needs and readiness.
How is firmographic data collected and what sources are most accurate?
Firmographic data is sourced by combining public records, third-party data providers, CRM enrichment tools, company websites, and professional networks such as LinkedIn.
Multi-sourced enrichment platforms, such as AI Ark, ZoomInfo, and Clearbit, are the most accurate sources because they continuously validate data among thousands of inputs. Other, highly reliable but less frequently updated, firmographics come from public filings such as SEC documents and annual reports.
How do businesses use firmographic data for segmentation and ICP development?
Businesses use firmographic data to segment companies by industry, size, revenue, growth stage, and location to determine which accounts are most likely to buy.
Companies can build precise ICPs only by analyzing their best-performing customers and matching patterns across firmographic variables. These ICPs, in turn, serve as guidelines for account targeting, ABM campaigns, lead scoring, sales prioritization, and personalized messaging.
What are examples of firmographic targeting and how does it improve conversion rates?
Firmographic targeting refers to campaigns designed to cater to specific company attributes, such as targeting mid-market SaaS companies with 200–500 employees or fast-growing healthcare startups.
This approach improves conversion rates because the messaging precisely fits each segment’s business model, challenges, budget, and growth priorities. Companies leveraging firmographic targeting see higher engagement, shorter sales cycles, and stronger ROI from ABM and outbound campaigns


