


There’s a steady shift that’s occurring in B2B sales, and it’s not a big one that you’re aware of.
When a buyer agrees to discuss your business with one of your representatives, they’ve read the reviews, watched the videos on YouTube, checked in with colleagues in Slack groups, and shortlisted two or three vendors. The old strategy of sending around a list and hoping something sticks is no longer effective with larger sales cycles, more people in on the decision, and the prospect of delegation. The “gut feel” approach to prospecting requires a significant amount of attention and time from your buyer, and not much of that at all, especially when your reps don’t have it.
That’s where data-driven B2B sales come in. It involves marrying the static data from your Customer Relationship Management platform with the sales insights derived from AI, enabling your sales team to zero in on the right accounts, send the right message at the right time, and avoid making guesses.
In this guide, we’ll show you what KPIs you need to understand, which ones really matter, beyond pipeline and win rates, and which ones are simply an excuse for a budget leak, and learn a realistic approach for getting started without busting your pipelines. No hype. Just what works.
What are data-driven B2B sales?
Data-driven B2B sales strategies involve leveraging firmographic data, technographic data, behavioral data, and intent signals, some of which may be powered by AI, to determine which companies to approach, when to approach them, and how to tailor the approach. It allows you to substitute intuition-based prospecting with measurable and repeatable signal-based decision making.
In the real world, it ultimately translates to your reps no longer working from a static list, but from a live signal – who’s hiring, who is doing research on your category, who is using a competitor, and who actually fits within your ICP. Decisions become smaller, quicker, and more accountable.
At a glance
- Who it’s for: B2B sales leaders, RevOps managers, SDR/AE teams, and growth marketers dealing with account-based or pipeline marketing.
- What data it uses: firmographic (company size, industry, geo), technographic (tools being used), behavioral (site visits, comments on content, usage of products), and buyer intent data from third-party signals.
- How AI fits in: scoring accounts, identifying the next best action to be taken, outlining customized outreach, and forecasting what type of deals are likely to close.
- What changes operationally: CMs prospect instead of prospects being sent through lists, CMs prioritize territories by fit and timing, CMs take the pipeline instead of the rep’s opinion.
- Typical outcomes: increased win rates, shorter sales cycles, smoother handoffs between SDRs and AEs, more accurate sales forecasts, and reduced wasted outbound efforts.
- What it is not: purchasing additional tools. It’s a science, with existing data and deliberate enrichment, applied in order to make better choices each week.
Why B2B sales are shifting from intuition to data
This trend towards data-driven B2B sales isn’t some new trend that was created at a conference. It is a reaction to three things that occurred simultaneously: buyers have different behaviors, outbound is more costly per meeting, and AI has finally helped make sense of all the signals that were there, but couldn’t be acted on in scale.
How buyer behavior has changed
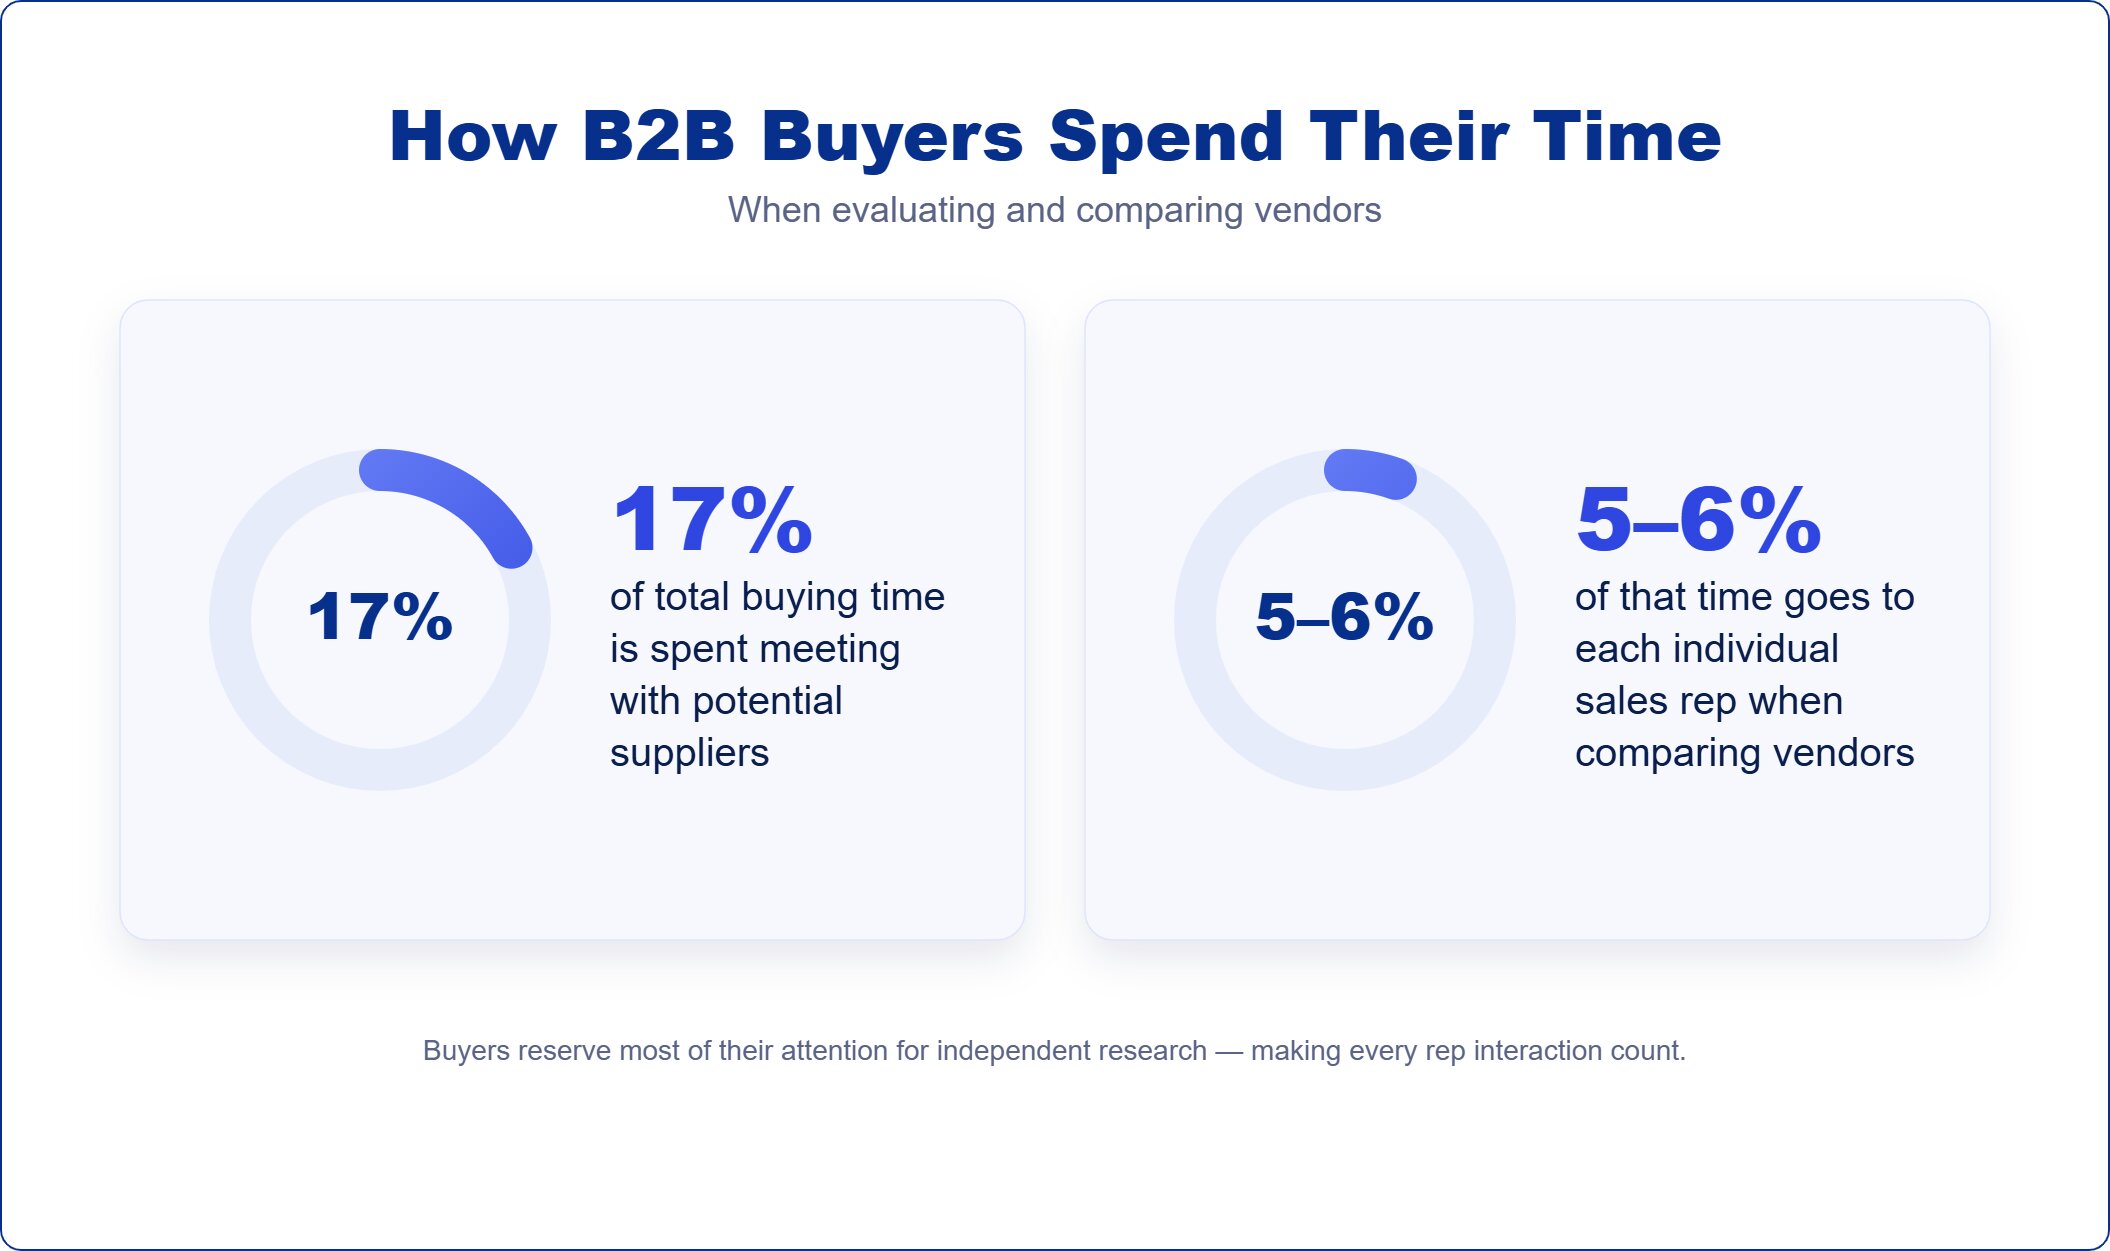
Your buyers don’t want to be sold the way they did ten years ago, and they don’t have to be. Gartner’s research shows that B2B buyers typically spend only 17% of their time meeting with potential suppliers when they are considering a purchase, and when they’re comparing multiple vendors, that drops to maybe only 5% or 6% with any single sales rep. Most of the journey now happens through independent research, peer conversations, review sites, and content.
Three patterns matter most:
- Self-service research dominates. According to a new Gartner survey of 632 B2B buyers, 61% want an overall rep-free buying experience, and 73% actively dislike suppliers who reach out to them with irrelevant content.
- Buying committees keep growing. A typical complex B2B purchase now involves 6 to 10 decision-makers, each bringing 4–5 pieces of independent research to the group. Gartner’s 2025 data puts the range as wide as 5 to 16 people across up to four functions, and 74% of buying teams show “unhealthy conflict” during the decision.
- Sales cycles are longer and more cautious. Larger committees, tighter budgets, and more procurement scrutiny all push timelines out, especially in mid-market and enterprise deals.
The bottom line for you is that if your reps only come to the table at the end, they are playing the buyer’s game. By using data-driven selling, you can capitalize on the fact that the accounts are in the process of looking, hiring, or changing priorities, as opposed to after the shortlist is in place.
Why traditional prospecting methods are losing efficiency
The old outbound, pull a list, blast a sequence, hope to get a few replies, business model continues to be the wrong one sometimes. Inboxes are full, spam filters are better, and 73% of consumers actively ignore vendors who don’t seem relevant to them.
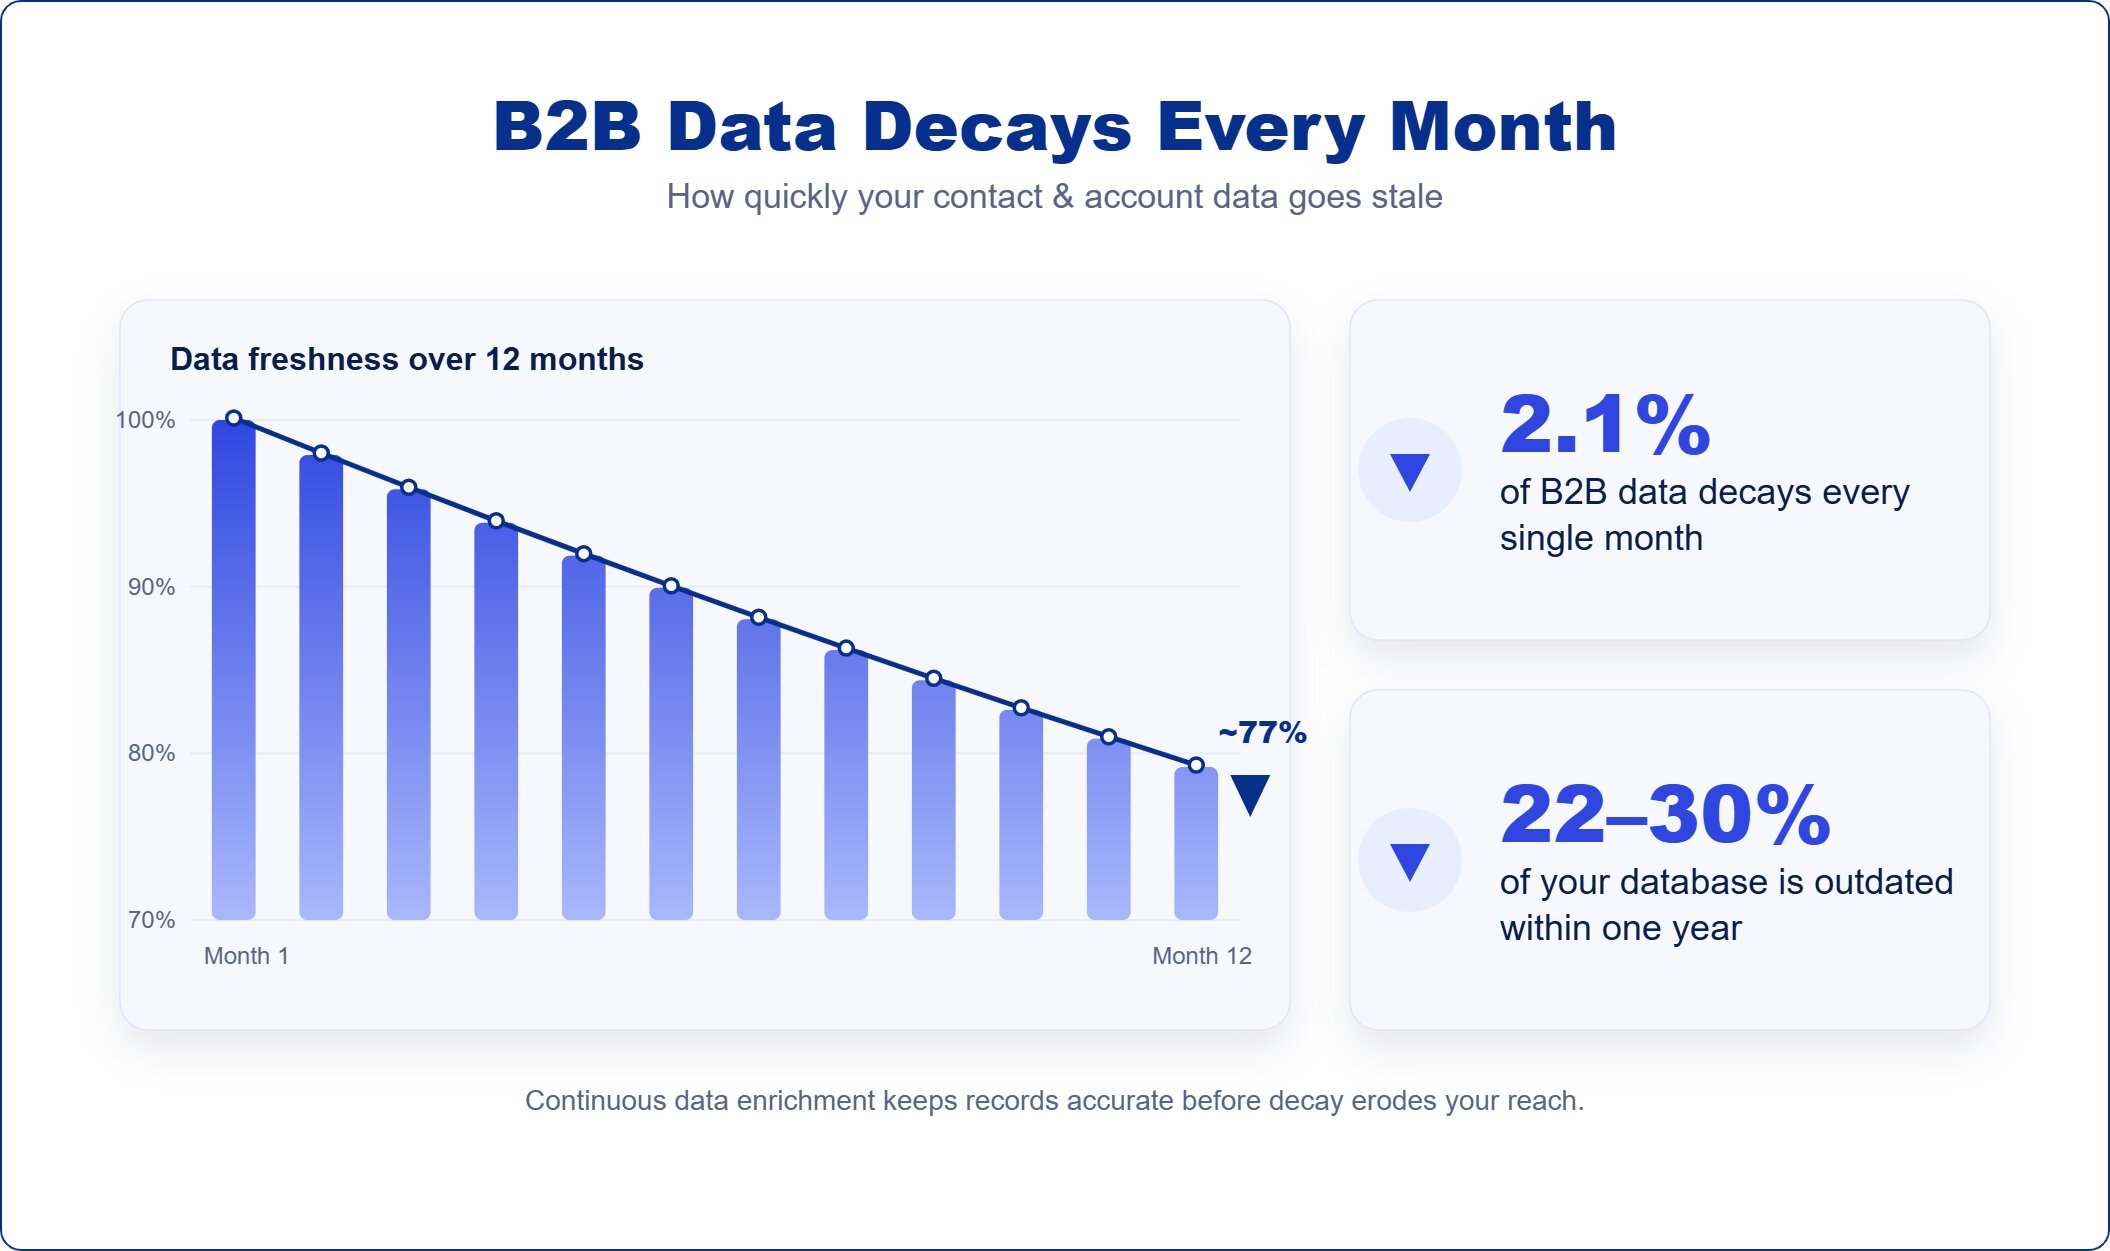
The more serious issue is that static lists quickly become out-of-date. Jobs are changed, companies shift, tech stacks shift, and budgets move quarter to quarter. Data decay has been reported to be at an estimated 22.5% per month for B2B data and even as high as 30% per year in other sectors such as tech and SaaS, which are rapidly changing. If your reps are calling or emailing the same accounts your competitors are calling/emailing with the same tools and same templates, you’re going to be playing with attention that’s already been stolen from you.
Data-driven prospecting changes the question from “who’s on my list?” to “who’s showing signals right now?” usually a much smaller, much more relevant set of accounts, worked with much better timing.
The role of AI and machine learning in modern sales workflows
AI and machine learning aren’t replacing your reps; they’re removing the work that was never a good use of a rep’s time in the first place. Today, that shows up across the workflow in a few specific ways:
- Account scoring and prioritization. The behavior and intent signals are used with the fit data to rank accounts by probability of purchase in ML models.
- Signal detection. AI watches for triggers, funding rounds, leadership changes, hiring patterns, intent spikes, and surfaces them before a human would notice.
- Personalization at scale. LLMs create outreach that is based on real context (recent blog posts, job changes, company news), letting reps spend time polishing instead of writing from scratch.
- Forecasting and deal health. Conversation intelligence and pipeline analytics flag stalled deals, missing stakeholders, or risky language in calls.
- Next-best-action guidance. Modern sales platforms suggest what to do next on a given account, based on what’s worked across thousands of similar deals.
The point isn’t to automate selling. It’s to make sure that when your reps do reach out, they’re talking to the right person, at the right account, at a moment when the conversation can go somewhere.
Data-driven vs. data-informed B2B sales: the real difference
You’ll see “data-driven” and “data-informed” used interchangeably across sales blogs, vendor pitches, and LinkedIn posts. They sound similar, but they describe two genuinely different ways of running a sales organization, and confusing them is one of the reasons teams either over-rely on dashboards or quietly go back to gut-feel selling.
Here’s the simplest way to tell them apart:
- Data-driven sales is when data is the catalyst for the decision. The numbers indicate the accounts to work, the deals to predict, and the investment of rep time. The output is then enhanced by human judgment, but not without a good reason.
- Data-informed sales is when the data is a part of the decision. Reps and leaders review and consider the information along with their experience and make the decision. The final decision rests with the human, with the data one of several inputs.
There is no better way of doing either. “Data-driven” suits high-volume repetitive actions such as SDR prospecting, lead scoring, and pipeline forecasting, in which consistency trumps personal insight. “Data-informed” does better when context and politics outweigh data, like with enterprise sales, where there are a lot of moving parts and fewer transactions.
Quick comparison:
| Data-driven B2B sales | Data-informed B2B sales | |
| Decision-making style | Data leads, humans refine | Humans lead, data supports |
| Role of data | Primary input drives prioritization, scoring, and forecasting | Reference input, checked against experience |
| Role of intuition | A check on the data, used when signals conflict, or context is missing | A primary input, especially in complex or strategic deals |
| Where it works best | High-volume, repeatable motions: SDR prospecting, scoring, forecasting, renewals | Complex enterprise deals, strategic accounts, novel situations |
| Typical KPIs | Conversion rates by ICP fit, pipeline coverage, forecast accuracy, win rates by signal type, and SDR-to-AE conversion | Deal-level qualitative reviews, relationship health, strategic account growth, and executive engagement |
| Risk if overdone | Mechanical execution; missing soft signals, the data can’t be seen | Slower decisions, inconsistent execution, hidden bias |
“Data-driven” doesn’t mean “human-free”
This is where most teams get it wrong. Data-driven selling isn’t about removing your reps’ judgment from the loop. It’s about changing what their judgment gets applied to.
In a gut-feel model, your reps spend judgment on questions that should be answered by data, which account should I work first, is this deal likely to close, who’s actually in-market right now? In a data-driven model, the system answers those questions, and your reps spend their judgment on questions only humans can answer well: how to position the solution for this specific buyer, when to push and when to wait, how to navigate a difficult procurement process, and whether the model is missing context it couldn’t have known.
The best teams work by a very simple principle: data drives decision making, and decision making drives improvement. When a model indicates an account is high-fit and high-intent, then work it except when a rep has a specific articulated reason to the contrary. It can be overruled, but it must be conscious, not automatic. This is the way to ensure that your motion has the feel of a data-driven move and doesn’t lack the human “signal” that makes a complex sale.
If you remember one thing from this section, make it that: data-driven doesn’t replace your reps’ judgment. It moves their judgment to the parts of the deal where it actually matters.
The four types of data that power B2B sales
When people talk about “data-driven B2B sales,” they usually mean one specific dataset they happen to have access to: a CRM enrichment tool, a website tracker, a third-party intent feed. But none of these on their own give you a complete picture. A real data-driven motion runs on four distinct layers, and each one answers a different question about an account.
Here’s the simplest way to think about them:
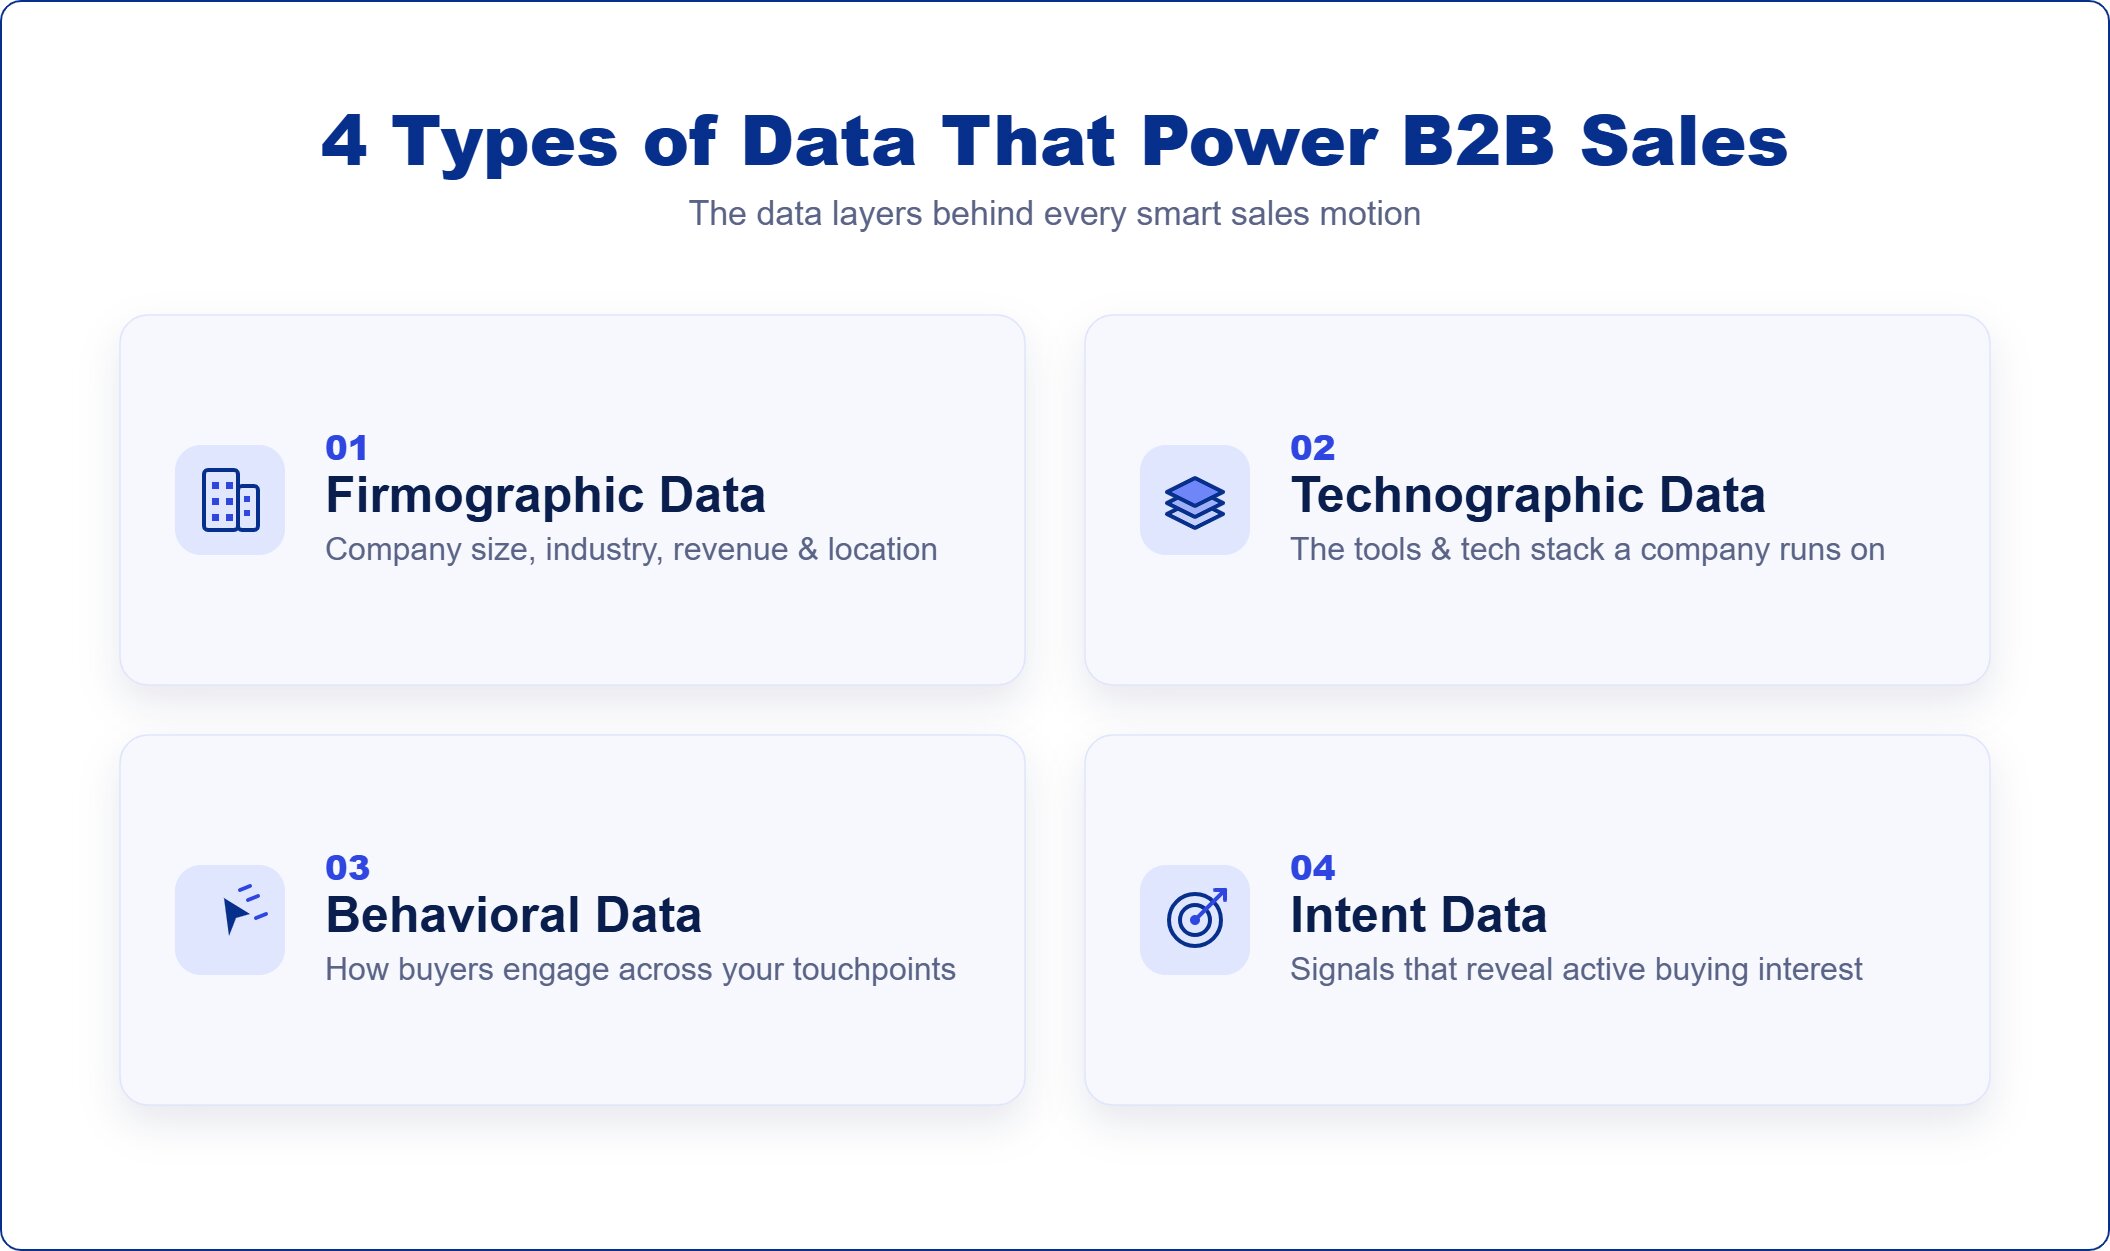
- Firmographic data answers “Who fits?”
- Technographic data answers “What do they use?”
- Behavioral data answers “How are they engaging with us?”
- Intent data answers “Are they in-market right now?”
You can run a sales motion with one or two of these. You can run a great one with all four working together.
Firmographic data: who fits
Firmographic information refers to information on the firm itself – the structural characteristics that dictate whether an opportunity can even be considered as a possible target. The common variables used for firmographics include the size of the business, industry classification, geography, company ownership type, stage of growth, etc.
This forms the base of your ICP. Without firmographics, you will not be able to determine whether this is even a company worth doing business with. Popular options include ZoomInfo, Apollo, Cognism, and Dun & Bradstreet, each covering its areas well, depending on the market and region.
Where teams go wrong with firmographic data is treating it as static. A company that didn’t fit your ICP last year may fit now; they raised a Series B, doubled headcount, or expanded into a market you serve. Refreshing firmographic data on a regular cadence is what keeps your ICP filter accurate.
Technographic data: what they use
Technographic data tells you what tools, platforms, and technologies a company already runs. If you sell a CRM integration, knowing which CRM a prospect uses changes everything about how you qualify and pitch them. If you sell a security product, knowing they recently migrated to AWS or adopted a specific identity provider creates the entry point.
The key here is not only the stack itself but rather the changes that occur within it. A recent move, replacement of a competing tool, or introduction of a product from an adjacent category will frequently provide a more powerful buying signal than merely a list of vendors in play. Services such as BuiltWith, HG Insights, and the technographics within ZoomInfo and 6sense provide access to this layer.
For your reps, the practical application would be qualification and customization, rather than asking “what have you been using?” at the beginning of their call, they walk in prepared and are able to focus entirely on the differences.
Behavioral and engagement data:
how they’re engaging with you
Behaviors include anything that happens with regard to prospects on the properties that you control. These behaviors can include website visits (what pages are visited, how many times, by what accounts), email opens and clicks, content downloads, webinars attended, demos requested, and any usage from your self-serve motion.
This is also called first-party intent data, and it’s the most reliable signal you’ll ever have, because it’s tied directly to your brand and your offering. If an account that normally reads zero articles about “sales intelligence” suddenly consumes fifteen in a single week, something has changed inside that organization, and if that activity is happening on your site, it’s a near-direct buying signal.
The problem with behavioral is that it’s only looking at those customers who have heard of you before. Behavioral tells us how many warm leads we have, but not how many prospects are out there in the market without knowing of your existence.
Intent data: who’s in-market right now
Intent data identifies signs of research and purchasing activity that take place off your company’s properties, through third-party publishers, review sites, searches, and content networks. Intent data gives us the information that CRM can’t: who is researching and considering a solution such as ours?
The standard taxonomy splits intent data into three sources:
- First-party: signals from your own digital properties (covered above as behavioral data).
- Second-party: another company’s first-party data, shared through a partnership. The most common example is review-site intent from G2 or TrustRadius, which can tell you when a target account is comparing your product against competitors.
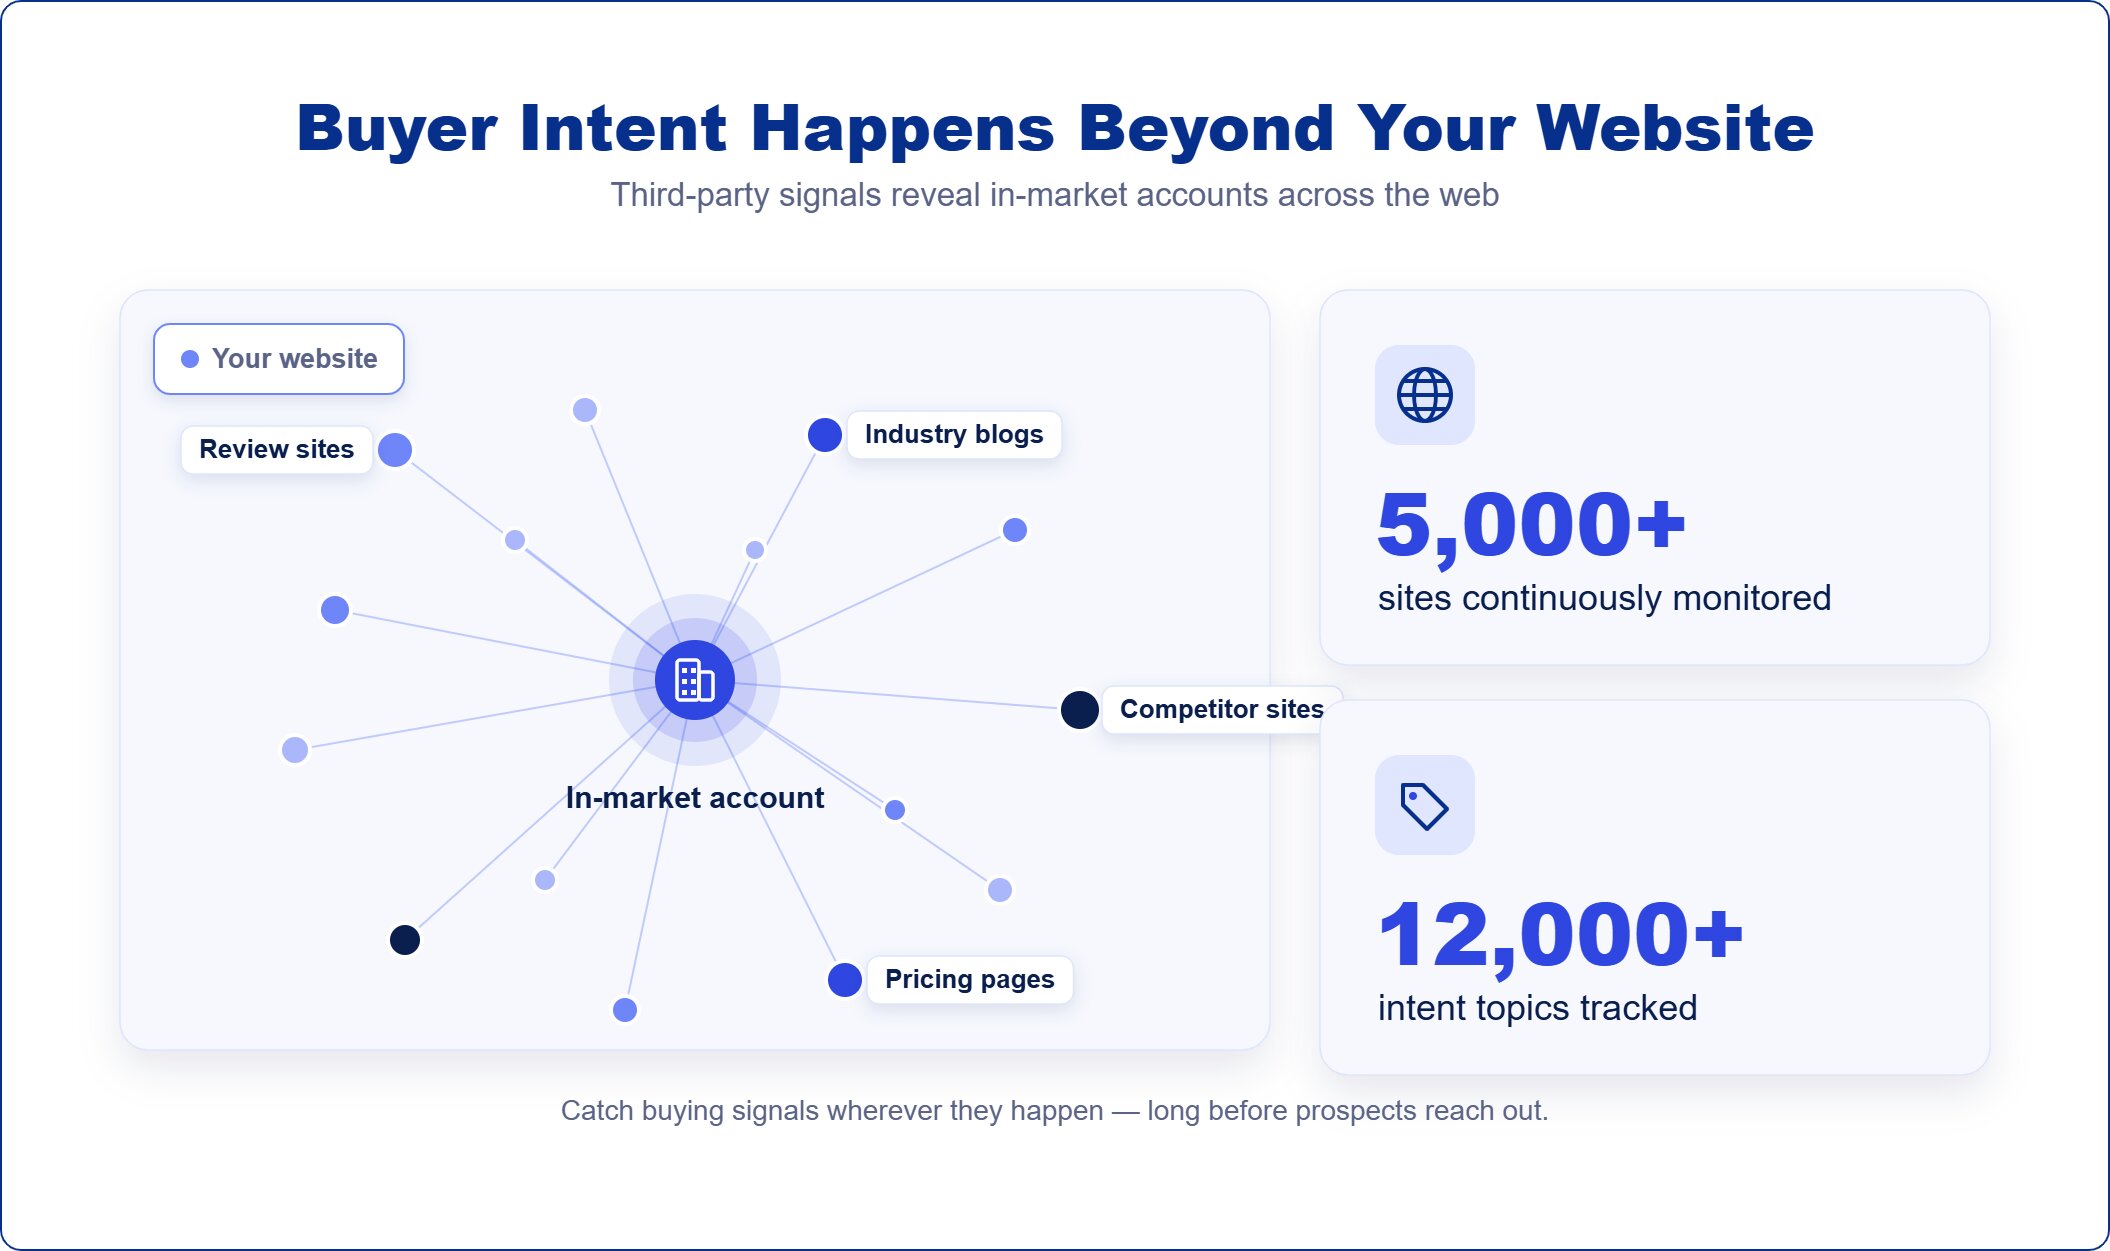
Third-party: aggregated signals from across the web. Bombora’s Company Surge data tracks content consumption across a cooperative of 5,000+ websites, categorized into roughly 12,000 topic clusters. Other major providers include 6sense, Demandbase, and TechTarget Priority Engine.
Topic surge is probably the most actionable signal. It is an instance where the volume of interest generated by the account around a particular topic rises significantly from its usual level. With a topic surge, we know for sure that it is not just general interest but some change that occurred within the organization. The challenge is to differentiate between a legitimate buyer and others, like competitors carrying out research or a journalist working on a story.
If you want a deeper view of the provider landscape, our guide to B2B intent data providers breaks down the major options and how to evaluate them.
How AI combines these layers into a single account view
When each of these four kinds of data is considered individually, it becomes apparent that it is quite useful, yet at the same time, limited on its own. Firmographics will give insight into who is eligible to buy, but not who actually makes purchases; technographics, into what people use, but not if they are researching or not.
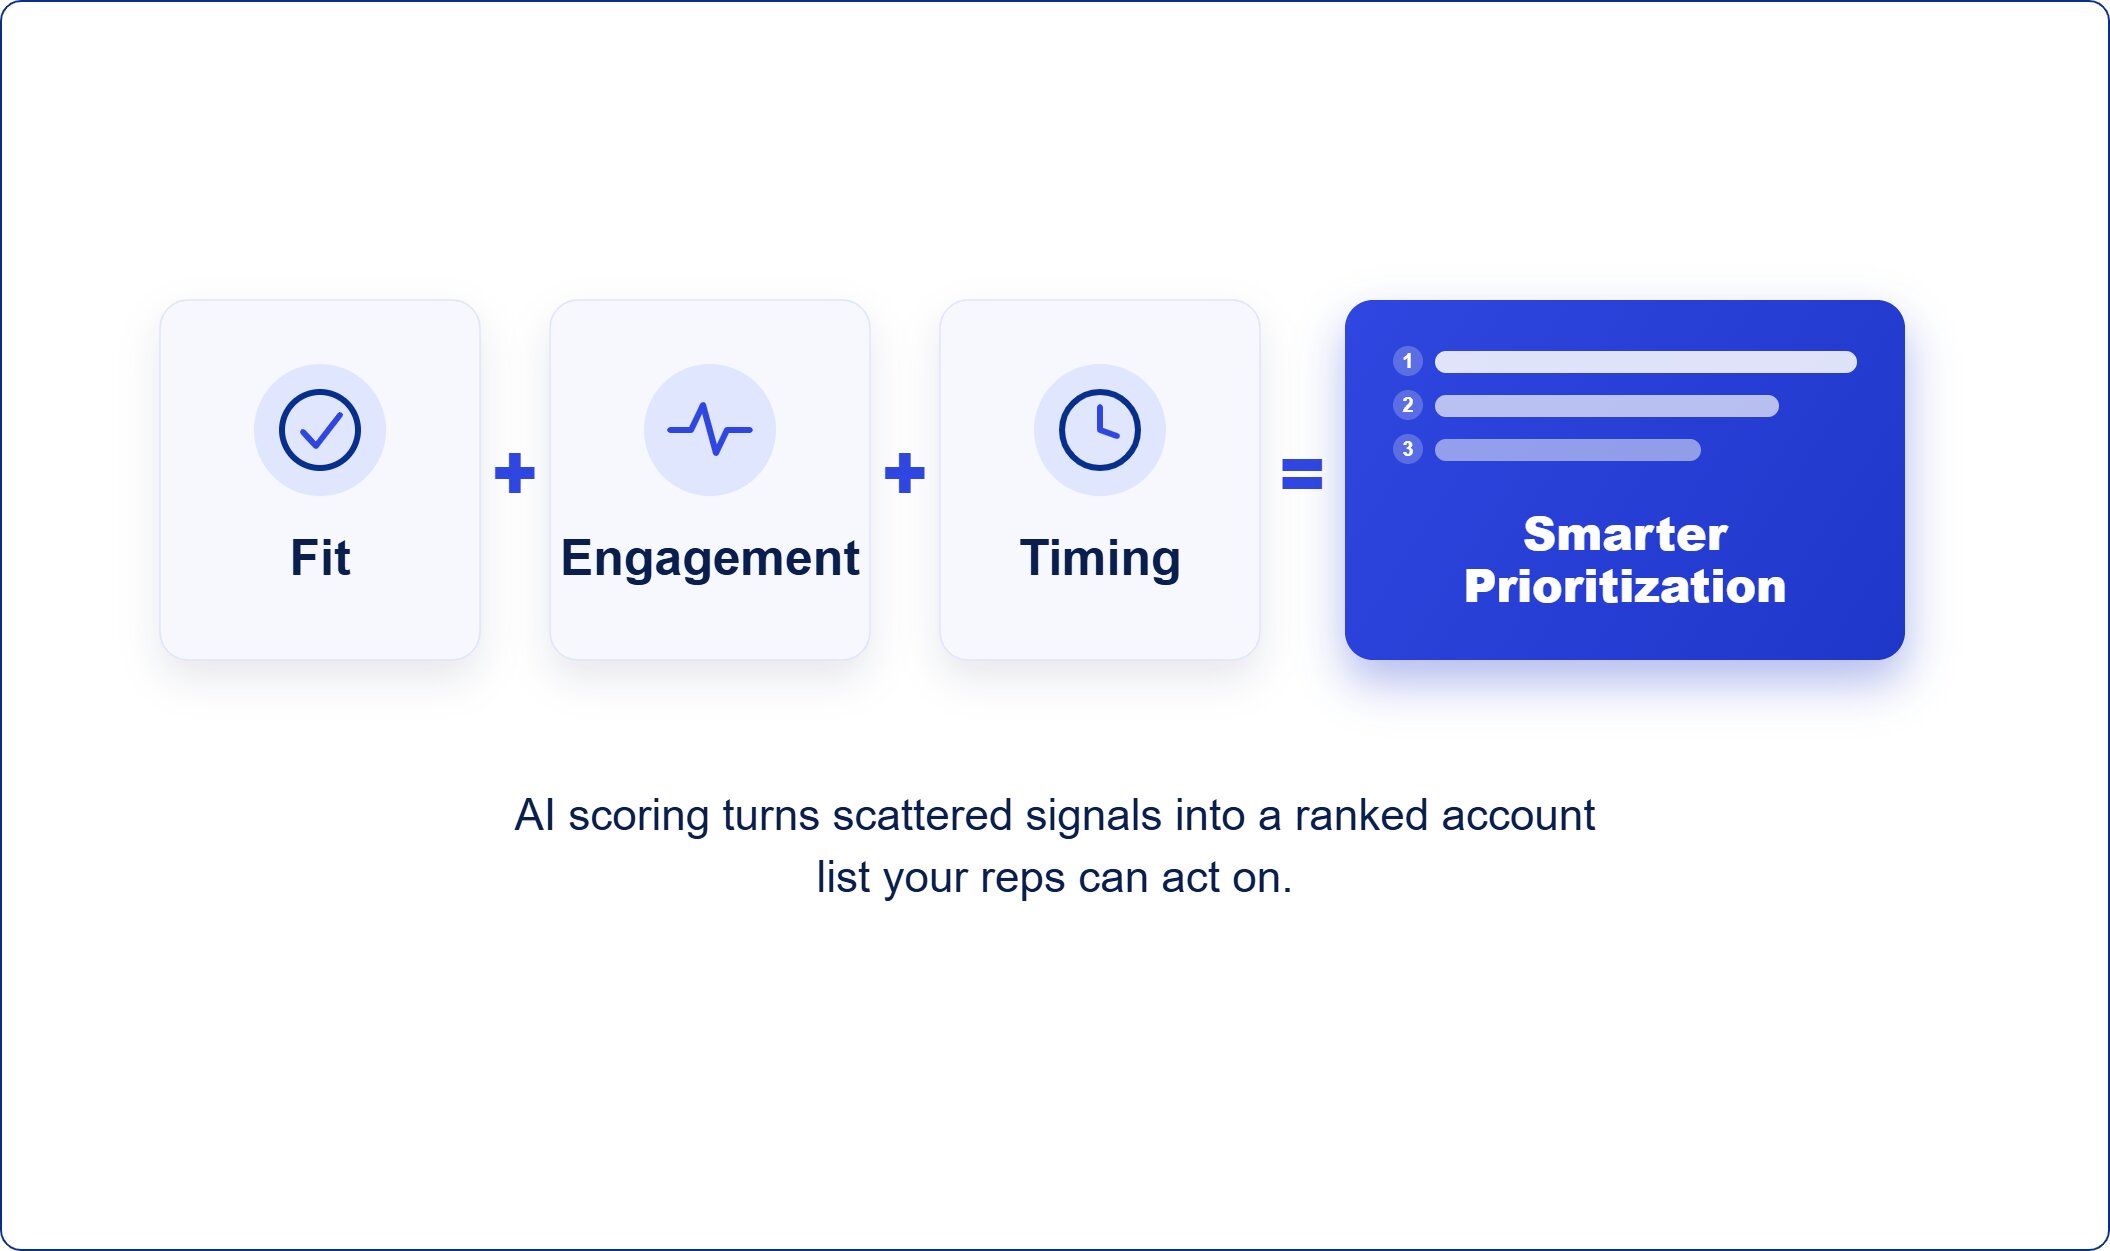
And the reason AI is relevant here is not because it creates new information but rather because it brings all these levels together. The current generation of sales intelligence and account intelligence tools utilizes machine learning to bring together fit (based on firmographics and technographics) with engagement (behavior) and timing (intent) to give an integrated account-level score and perspective. Rather than have your reps switch between four different solutions and three tabs on their browsers, all they have to look at is one account-ranking list, including explanations for each ranking point.
That’s the practical payoff of a data-driven motion. No more data, better-combined data surfaced as a clear next action.
A practical framework for building a data-driven B2B sales motion
A data-driven sales motion isn’t one project. It’s a sequence of six steps, and the order matters. Skip the foundation, and the later steps will produce confident-looking output built on bad inputs. Most teams that struggle with “AI in sales” haven’t actually failed at AI; they’ve failed at steps one and two, and everything downstream inherited the mess. Here’s the sequence that holds up in practice.
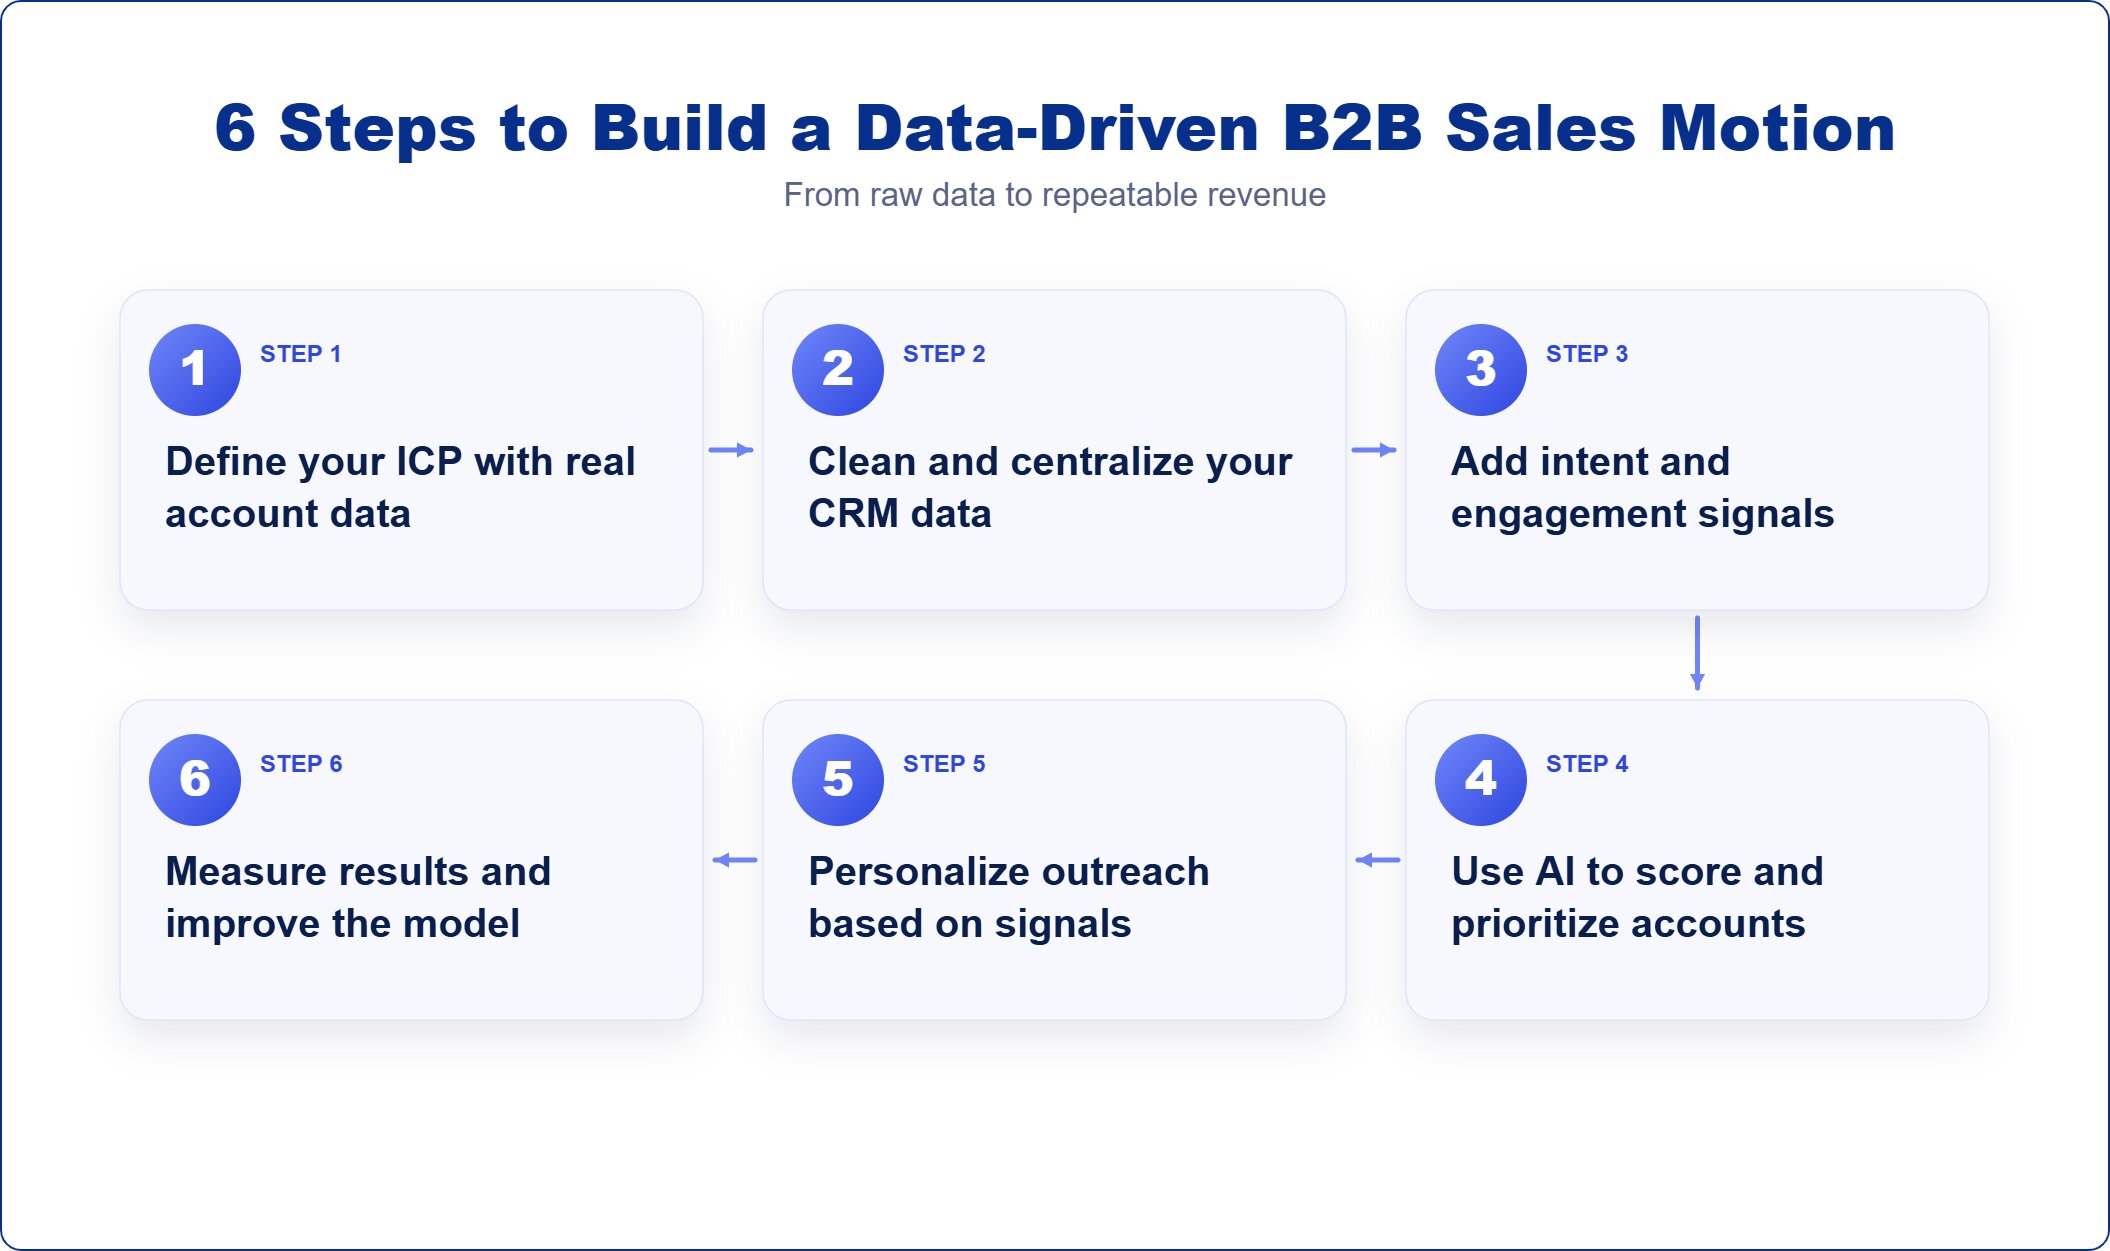
Step 1: Define your ICP using real account data, not assumptions
A strategy document or a paragraph on your website is not your ICP. Your ICP should come from your closed-won data, not your strategy document or a paragraph on your website. It’s a description of the accounts that really buy, grow, and keep. Generally, it’s much narrower than the market you think you’re in.
First, go through all of your past 12 to 24 months of wins and analyze them to see what they share in common. Next, repeat the process with closed-lost and churned accounts. Your actual ICP is the patterns that you see.
What to look at in your closed deals:
- Number of employees and revenue
- Industry and sub-industry
- Geography
- Tech stack signals (What they used prior to you, what they integrated.
- The duration of the selling process and the size of the deal.
- What segments grew following the initial contract
Your deliverable: Documented ICP, firmographic criteria, technographic criteria, Disqualifiers, Tiered (Tier 1 best fit, Tier 2 good fit, Tier 3 acceptable). The rest of the framework will fall apart if the sales and marketing teams don’t have a common understanding of what a Tier 1 account is in a “business-to-business” sense. If you’re interested in more details on decision-making at the leadership level, read our article on data-driven B2B decision-making.
Step 2: Centralize and clean your data (CRM hygiene, enrichment, deduplication)
If your CRM contains stale, duplicated, or incomplete data, then all signals downstream from it will be unreliable. This is the mundane part that determines if the rest of the framework functions.
Three things matter here:
- Deduplicate. Teams tend to overestimate the number of duplicates. Without active data quality initiatives, industry analyses show that rates of duplication range from 10% to 30%; best-in-class entities report less than 2%. One duplicate splits up engagement into two records and obscures actual buying patterns.
- Enrich. Comply with missing firmographic and technographic fields by filling them in with a provider suitable for your market. There are significant regional, segment, and industry differences in coverage. Our guide to B2B data providers explains the significant choices.
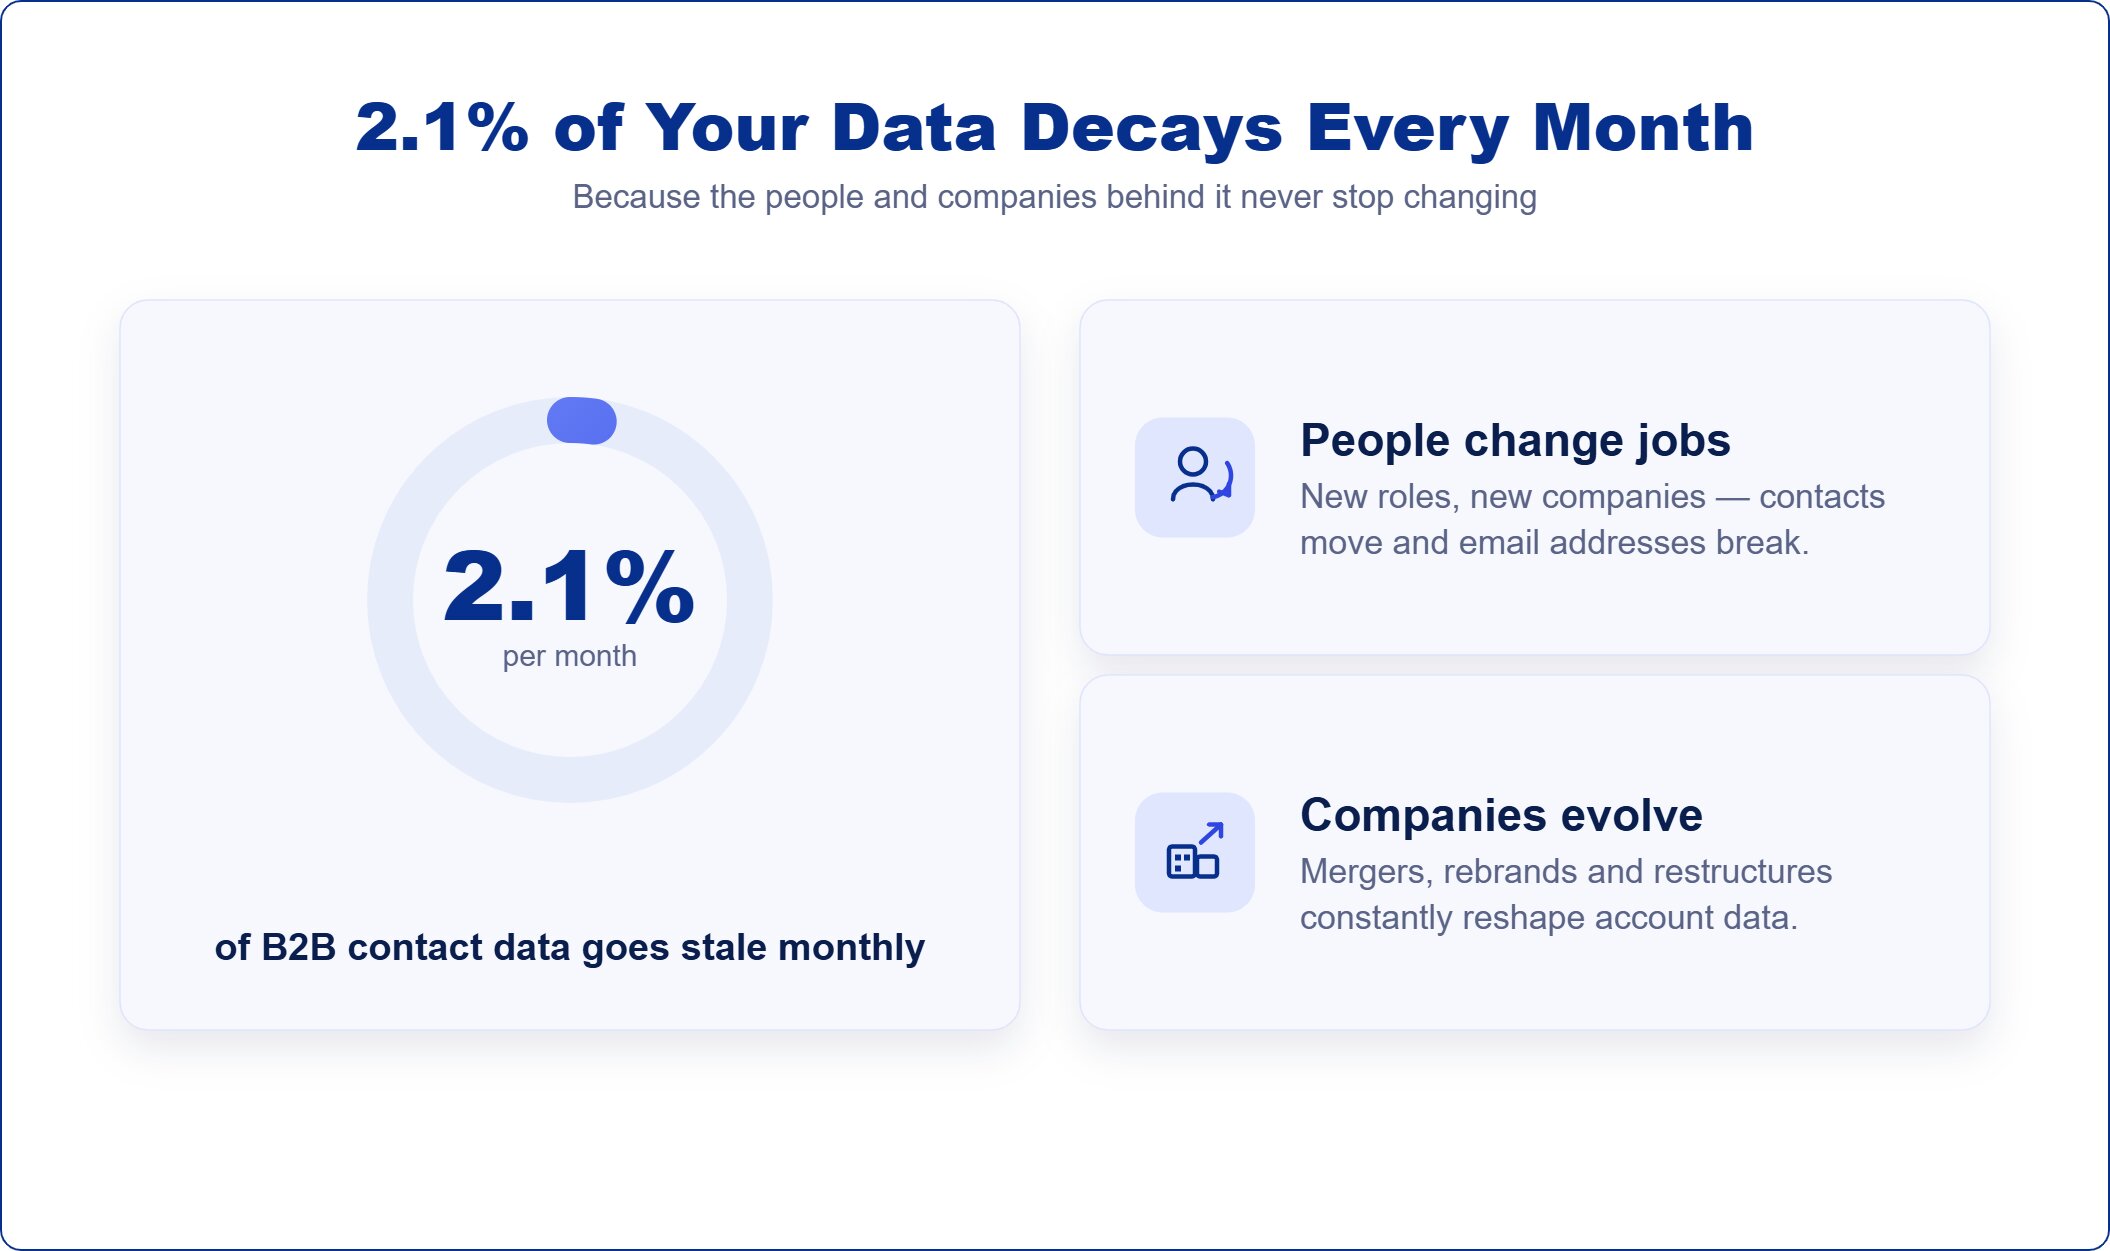
- Establish a refresh rate. Contact data in B2B fades at an average rate of 22.5% annually, or approximately 2.1% monthly, due to changing jobs and corporate turnovers. Cleanup is just as much work if it’s not a continuous process. Industries with high turnaround, such as staffing and tech, require a shorter turnaround.
Your deliverable: a CRM you can rely on to cover the basics. An account exists only once, the firmographics for the account are correct, the key contacts are up-to-date, and you know when each field was last verified.
Step 3: Layer in intent and engagement signals
After you have a clean foundation, add in the signals you use to indicate when an account is valuable to work, but not when it fits.
Use the items that you already have. First-party engagement data from your website, email tool and marketing system is the best indicator you will have, as it is directly tied to your brand. From there, add in the outside-the-propets third party intent, topic surges, review-site activity, and category research.
The stimulus elements to take into account:
- First-party: advanced analytics, demographic information, and general data trends
- Second-party: sites such as G2, Trustradius, and other partners’ data.
- Third-party: topic sparks from companies such as 6sense, Bombora, Demandbase, and TechTarget Priority Engine.
The mistake to avoid: acquiring more signals than the team can respond to. Three or four clear signals that can always elicit a rep response are more valuable than 15 feeders that don’t open.
Your deliverable: a shortlist of high-confidence signals, where each signal is linked to a rep action.
Step 4: Score accounts and prioritize with AI
Account scoring combines fit, engagement, and timing into one ranked list. Your reps know which accounts to work first.
Now you have the three inputs: fit (firmographic, technographic), engagement (first-party behaviors), and timing (third-party intent). The easiest form of scoring is rule-based: assign weights to inputs, add up the weights, and sort the list. The more powerful version will use machine learning to identify combinations of signals that it sees that your rules wouldn’t detect, but that have historically been correlated to closed-won deals in your data specifically. This type of predictive scoring is a feature that most contemporary sales intelligence systems incorporate by default.
The difference between a score used score and a score ignored score:
- Transparency. Reps should not only see the number, but the reasons why it is placed there.
- Action. Prioritization equals pipeline; every score should relate to a next step, play, sequence, or meeting motion.
Your deliverable: you need to create a daily ranked account list for each rep to work from, and the top reasons to see on each account.
Step 5: Personalize outreach based on signals, not templates
Real personalization involves the resonance of the signal that raised the account, rather than the addition of a name and company.
One of the most common places where data-driven sales go wrong. Teams create their data, add in intent, score their accounts, and then their reps send the same five-line template to all in the list. The signals are lost as soon as the outreach does not match them.
The actual outreach with signals is:
- A new VP of Engineering at a Tier 1 account → reference hire and priority change, it likely causes
- If the surge is related to the category → you’ll be referencing the topic, not “I saw your company.”
- Repeat visits to pricing page(s) (if they are cold) → accept that they are considering, do not pretend they are cold
This is where AI comes in, and only as a drafting aid. It offers the ability to create a powerful initial draft based on the signal data, but your reps do still need to review, refine, and send it. The idea is not to automate it, but to ensure that each outreach is based on the individual reason the account is coming up.
Your deliverable: outreach where every message references the signal that triggered it.
Step 6: Measure, learn, and feed insights back into the model
Every signal you act on and every deal you win or lose is feedback, and if you don’t feed it back into your scoring and ICP, the model stops improving.
Most teams miss this step, and that’s what makes a data-driven motion project a system.
Regular Cycle to review:
- What are the true signals in your data that indicate closed-won deals (not vendor benchmarks)?
- If you thought signals were important that aren’t (or aren’t anymore), delete or reduce them.
- If your ICP still aligns with your closed won patterns this quarter.
- Where compromises are failing, and what are the indicators that it is time to call it quits.
Your deliverable: a quarterly review that updates your ICP, signal weights, and scoring model based on the previous quarter’s outcomes.
That’s the framework. Six steps, each building on the last, each with a clear deliverable. If you’re starting from scratch, you don’t have to run all six at once; most teams get a meaningful lift from doing the first three well before adding the rest. The goal isn’t perfection. It’s a system that gets sharper every quarter because you’re actually closing the loop.
The KPIs that actually matter in a data-driven sales
In many ways, the issue with most B2B sales dashboards is that they have too few metrics. It’s because they have too many, and the majority are measures of activity, not outcome. Data-driven sales orgs follow a tighter set of metrics that tell you whether your data, your scoring, and your motion are bettering your pipeline and better deals.
You do not have to have all of the measures below on day one. Choose the three that correspond to the bottleneck that you are most interested in at the moment, and take the remainder as your motion becomes more evolved.
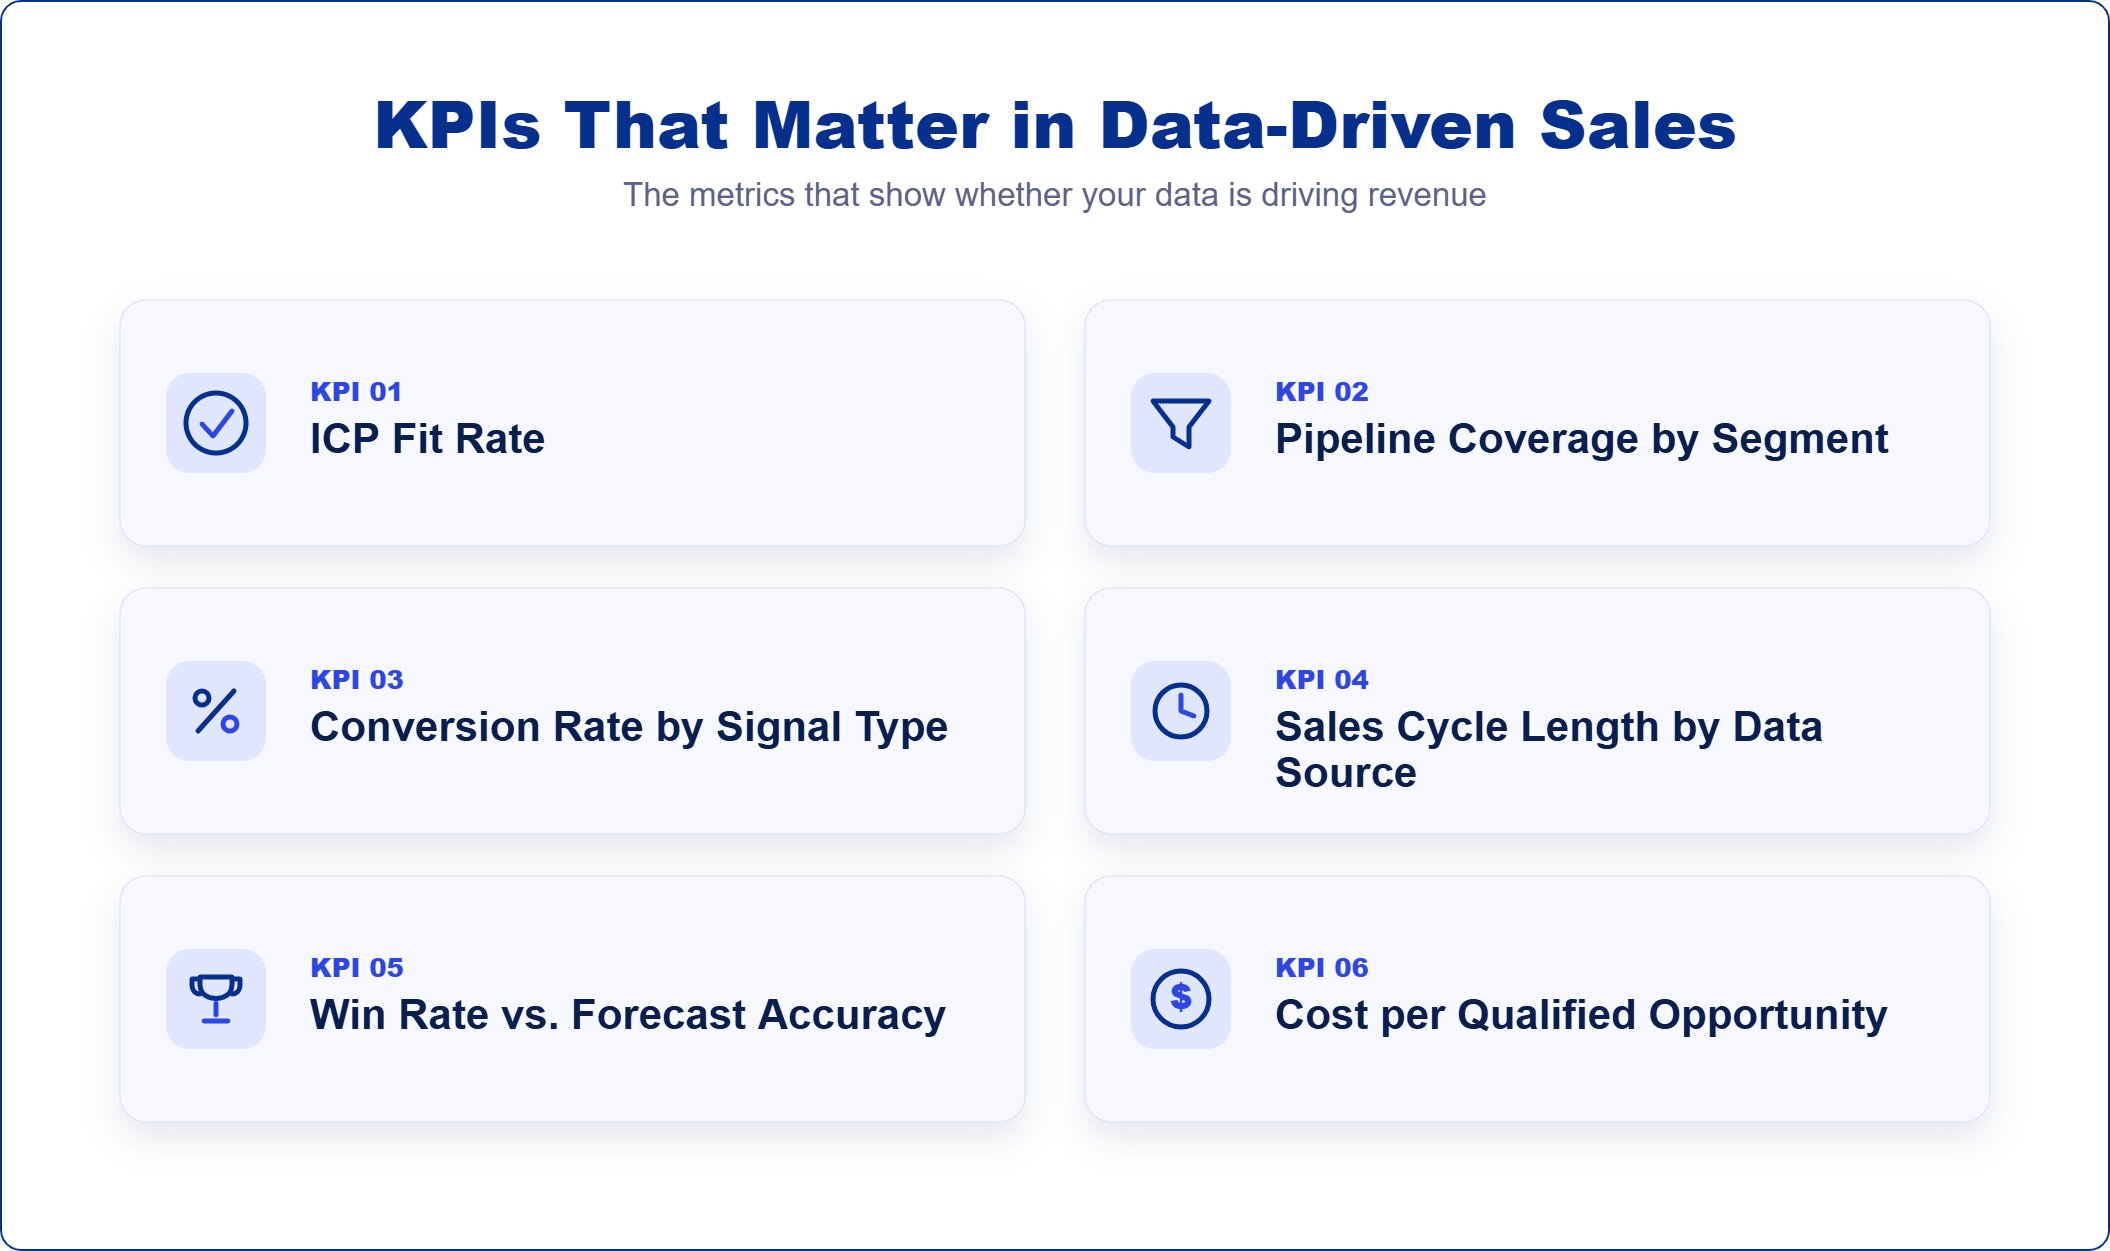
Quick reference: the six KPIs at a glance
| KPI | What it measures | Healthy direction |
| ICP fit rate | % of pipeline (or closed-won) made up of ICP-aligned accounts | Rising quarter over quarter |
| Pipeline coverage by segment | Coverage ratio broken out by ICP tier or vertical | Balanced; highest-value segments at or above aggregate |
| Conversion rate by signal type | Pipeline & revenue conversion per signal source | A clear hierarchy emerges within 1–2 quarters |
| Sales cycle length by data source | Days-to-close by how the account was sourced | Shorter on signal-surfaced vs. cold-sourced accounts |
| Win rate vs. forecast accuracy | Close rate of qualified opps + forecast precision | Both rising; forecast within ±10% of actual |
| Cost per qualified opportunity (CPQO) | Total spend ÷ qualified opportunities produced | Stable or falling as data and prioritization mature |
1. ICP fit rate
- Definition: Account penetration of your pipeline (or closed won deals) that are your ideal customer.
- What it measures: If your reps are not spending their time where they should, rather they are just letting easier, lower-fit deals get away because they’re more responsive.
- Why it matters: It’s important because the fit of an ICP in the pipeline typically translates to a low win rate downstream. It is the best indicator of the discipline of your motion.
- Healthy direction: Upswing over time. As you get more experienced with your scoring and prioritization, your ICP fit rate should increase in every quarter.
2. Pipeline coverage by segment
- Definition: Qualified pipeline/revenue target, segmented by ICP tier or vertical, rather than by total.
- What it measures: Does your pipeline have enough segments to make your best deals, or just enough segments?
- Why it matters: Covering up major deficiencies, you may have 4x coverage overall, but thin at your highest value segment under the pretense of having excess pipeline in your half as likely to close segment.
- Healthy direction: Balanced. Coverage for your highest value segments should be at least as good as your aggregate ratio; preferably better.
3. Conversion rate by signal type
- Definition: Pipeline and revenue conversion rates for each of the intent surges, engagement spikes, technographic triggers, and hiring events surfaced accounts.
- What it measures: Which of the signals you’re paying for actually produce deals in your specific motion.
- Why it matters: Every intent provider and engagement tool claims their data drives results. In your specific motion, with your specific ICP, some signals pull their weight, and some don’t. This metric tells you which is which.
- Industry context: Industry benchmark: In B2B SaaS, the average rate of converting MQL to SQL is 15–21%, and the average rate for opportunity to close is 20–30%. If the signal is working, your conversion should be higher than your blended average by signal type.
- Healthy direction: Within one to two quarters, it becomes clear how many of your pipeline’s signals are driving the most, and you can safely cull the ones that aren’t.
4. Sales cycle length by data source
- Definition: The measurement of pipeline velocity from initial opportunity creation to closed-won status, segmented by the lead source or intent signal that triggered the engagement.
- What it measures: Whether high-intent signals are successfully compressing the sales cycle or if the outbound motion is suffering from friction and signal noise.
- Why it matters: A data-driven motion should produce shorter cycles on signal-sourced accounts. If accounts surfaced by your top intent provider close at the same time as cold-outbounded ones, the intent data isn’t doing what it’s supposed to.
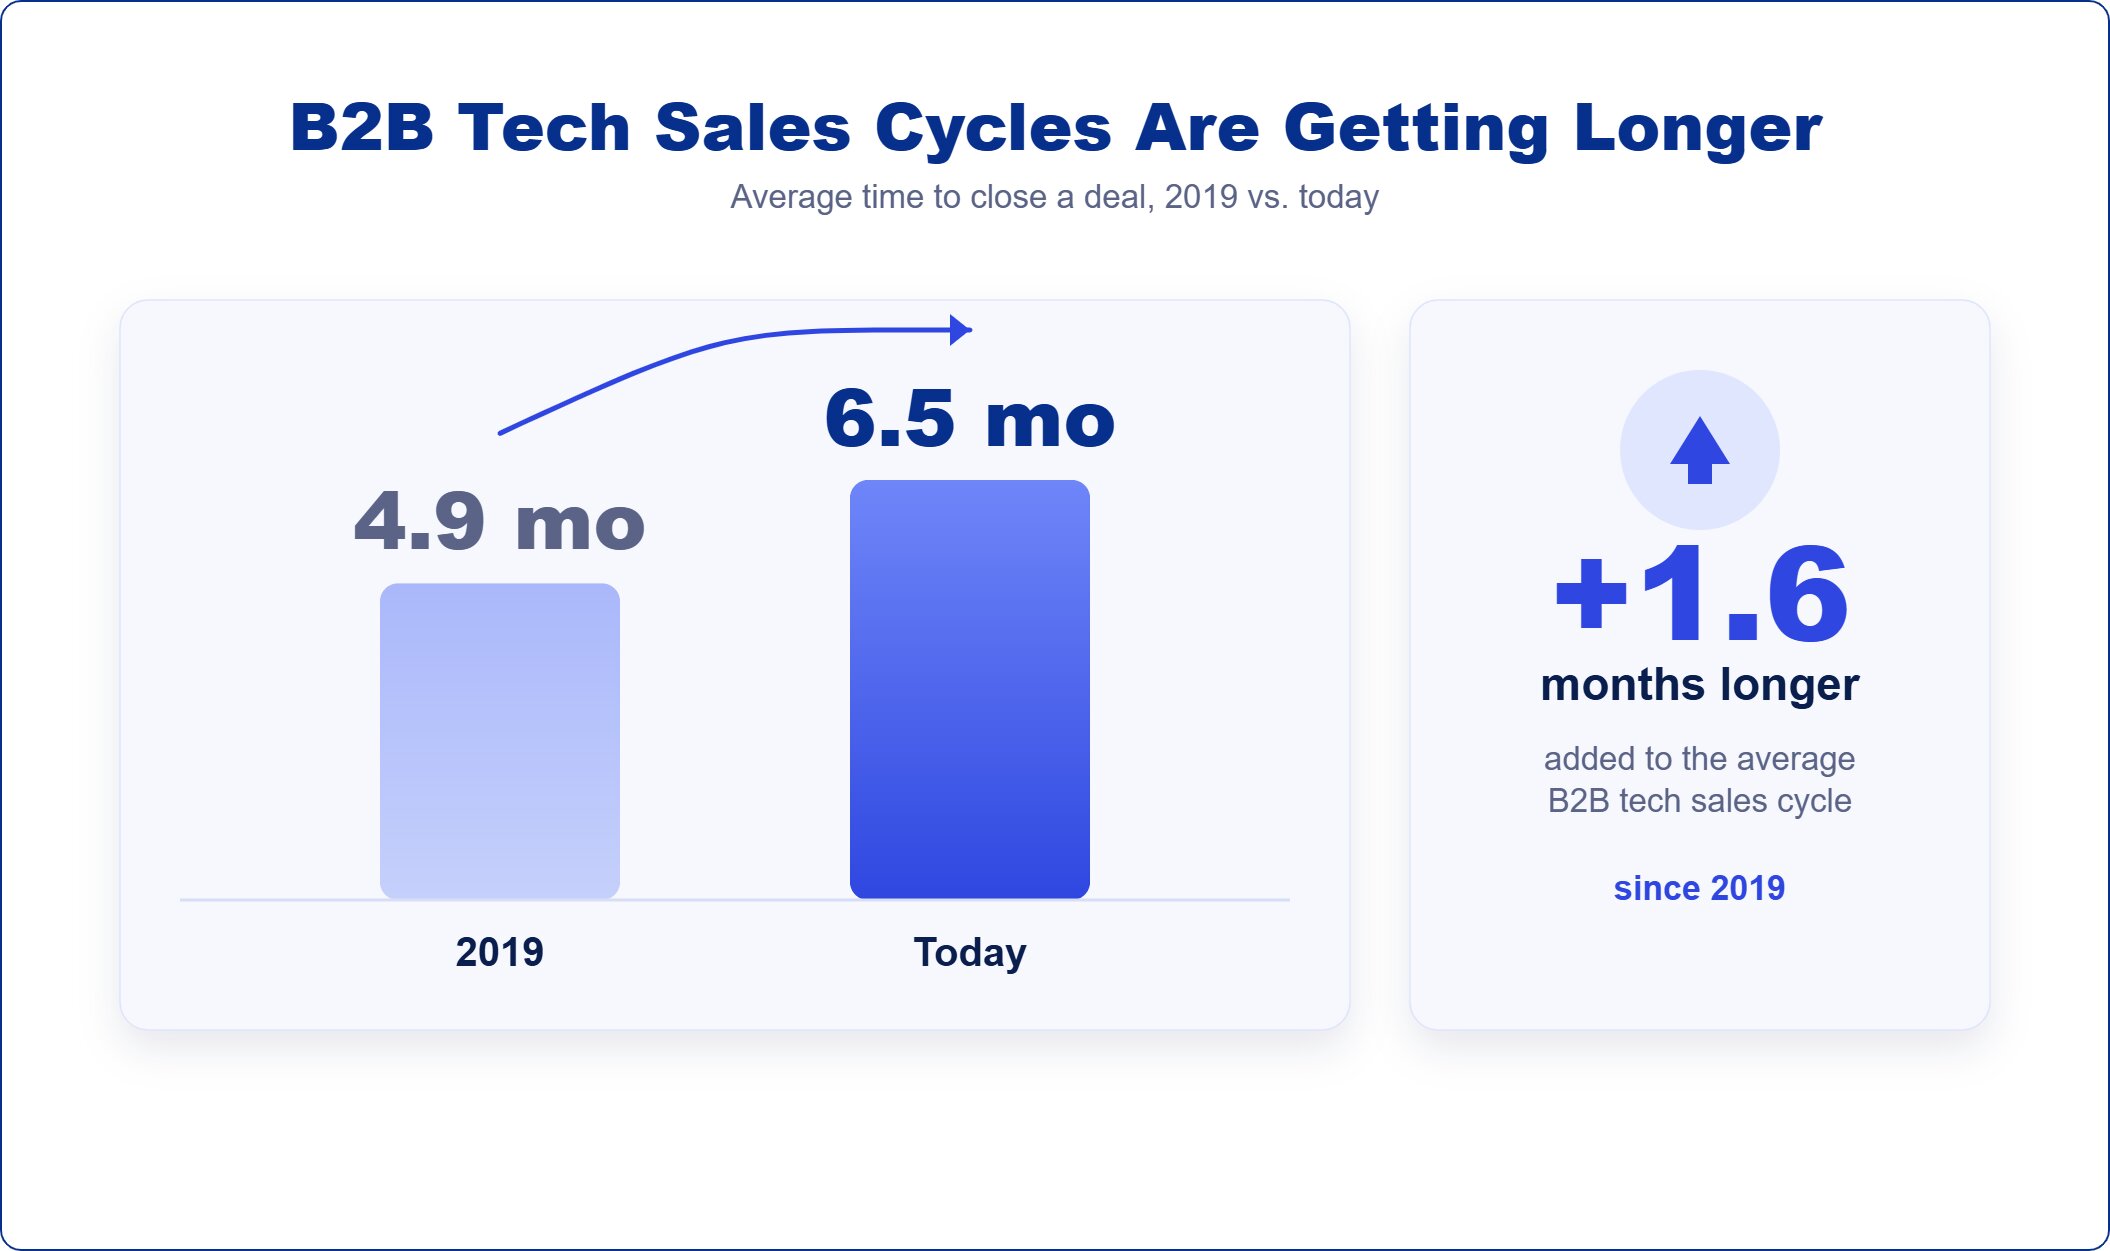
- Industry context: The average B2B tech sales cycle has increased significantly from 4.9 months in 2019 to 6.5 months. Deals valued over $100K may take 6-9+ months. In that context, it is significant if there is any prolonged squeeze on signal-sourced deals.
- Healthy direction: Cycles should become shorter on signal surfaced accounts than on cold outbound, particularly as the team gets more adept at being timely with these signals.
5. Win rate vs. forecast accuracy
- Definition: Win rate is the percentage of the number of qualified opportunities that convert to sales. The accuracy of your forecast is the percentage of times you correctly predict the result on those opportunities.
- What it measures: If your data is really helping you sell, not just report, it is!
- Why it matters: Only following one is misleading. A high win rate and low forecast accuracy indicate that you’re lucky! High accuracy, low win: You have a good idea about your pipeline, but aren’t winning enough of it. The actual signal is the combination.
- Industry context: Win rate is approximately 20-21%, with the best performing companies at 30%+. When it comes to forecasting, just 45% of sales leaders say they are very confident in the accuracy of their forecasts, and companies that are more successful with revenue intelligence tend to be more accurate within 10% of their actual revenue with their forecasting.
- Healthy direction: Both increasing the accuracy of your forecast and improving with more signal data available in your scoring model and pipeline reviews.
6. Cost per qualified opportunity (CPQO)
- Definition: The cost of all expenses, divided by the number of qualified opportunities generated in the same period of time.
- What it measures: If you’re more efficient, or if you’re just costlier.
- Why it matters: On its own, adding tools, enrichment, and intent feeds will improve some metrics. However, if CPQO rises by more than the win rate or deal size, the motion starts to become more of a burden than an asset. CPQO drives all new investments to prove themselves by opportunity output.
- Healthy direction: Stable or falling over time as better data and better prioritization reduce the effort required to produce each qualified opportunity.
Last word on benchmarks: it’s tempting to follow the numbers vendors tout, but there are just too many variations in the numbers by segment, deal size, and the definition of what the number represents to make them useful to follow. What is important is your own standard. Now take a snapshot of where you are on each of these six KPIs and then check your progress again in 90 days. If it’s correct, you’re on the right path.
Common mistakes that derail data-driven sales initiatives
Most data-driven sales programs don’t fail because the data is wrong. They fail because of how teams use it. Across the B2B sales teams we work with at AI Ark, the same six mistakes show up over and over, and once you’ve seen them, you’ll recognize them in your own motion.
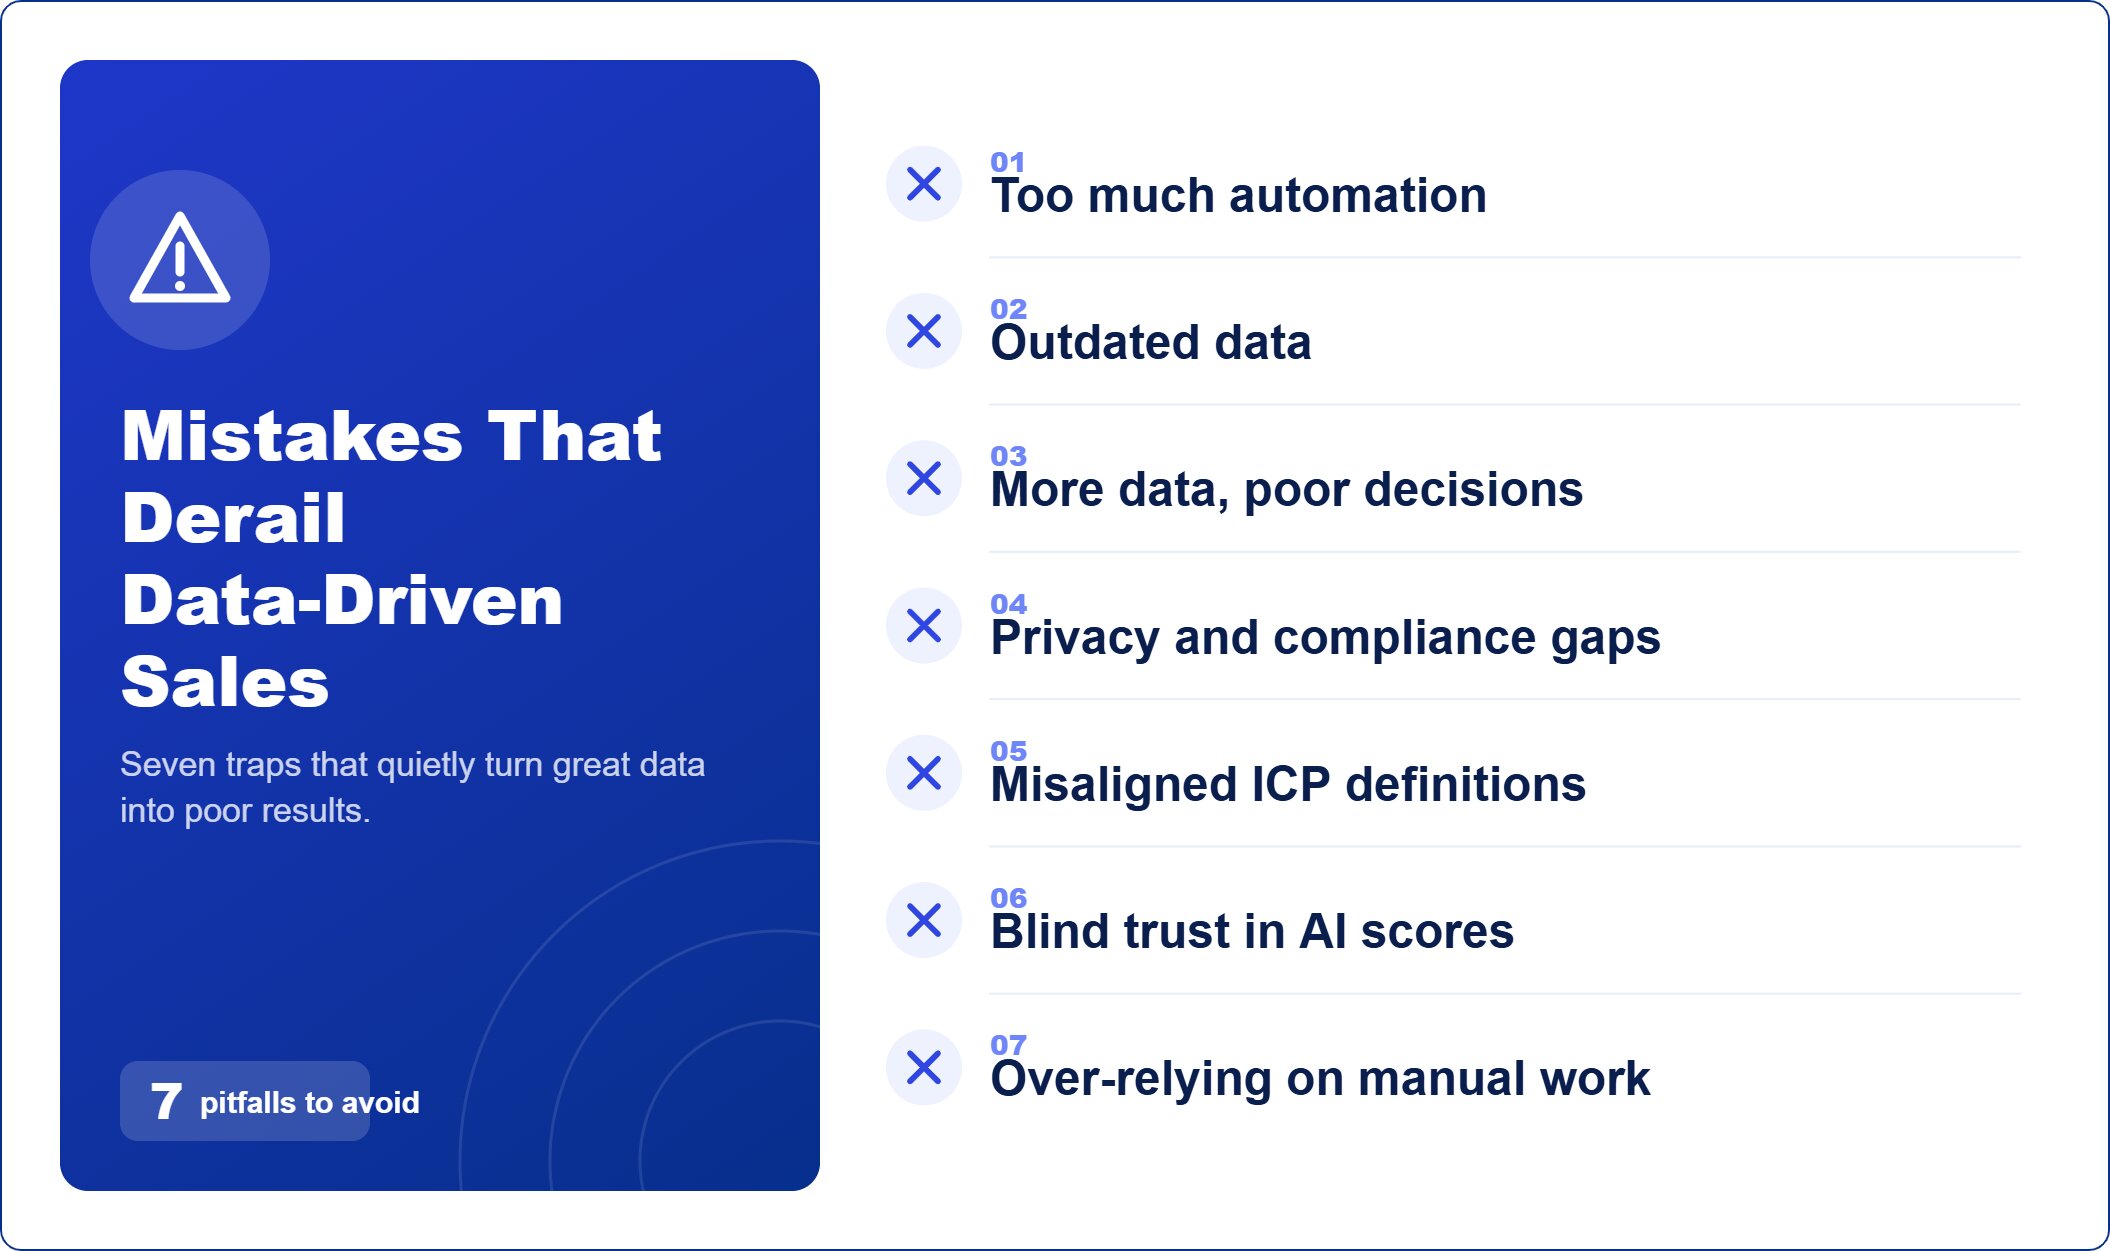
Automation should free up your reps’ time for work that requires judgment, not that it should take the place of judgment. When AI-generated emails are sent out without anyone reading them, the response rate declines, and you’re missing out on the “soft signals” that only a human could pick up on. Create, research, and prep with AI. Have a person on each send.
Acting on stale data.
B2B contact data is typically 22.5% off the mark after a year, meaning that the list generated in January is significantly different by the middle of the year. The fix isn’t pretty; it’s simple: establish a refresh schedule, display the dates of “last verified” within the CRM, and view data freshness as a metric to be tracked, rather than a single, periodic cleanup.
Confusing “more data” with “better decisions.”
It’s easy to think that as you buy more signals, you are making progress, but that’s not actually the case. The winning teams with a data-driven sales method typically rely on three to four indicators that are linked to a specific play instead of on fifteen feeds that people do not open. Don’t add before subtracting.
Ignoring privacy and compliance.
This is the one most teams underestimate, especially when selling globally. The exposure is real:
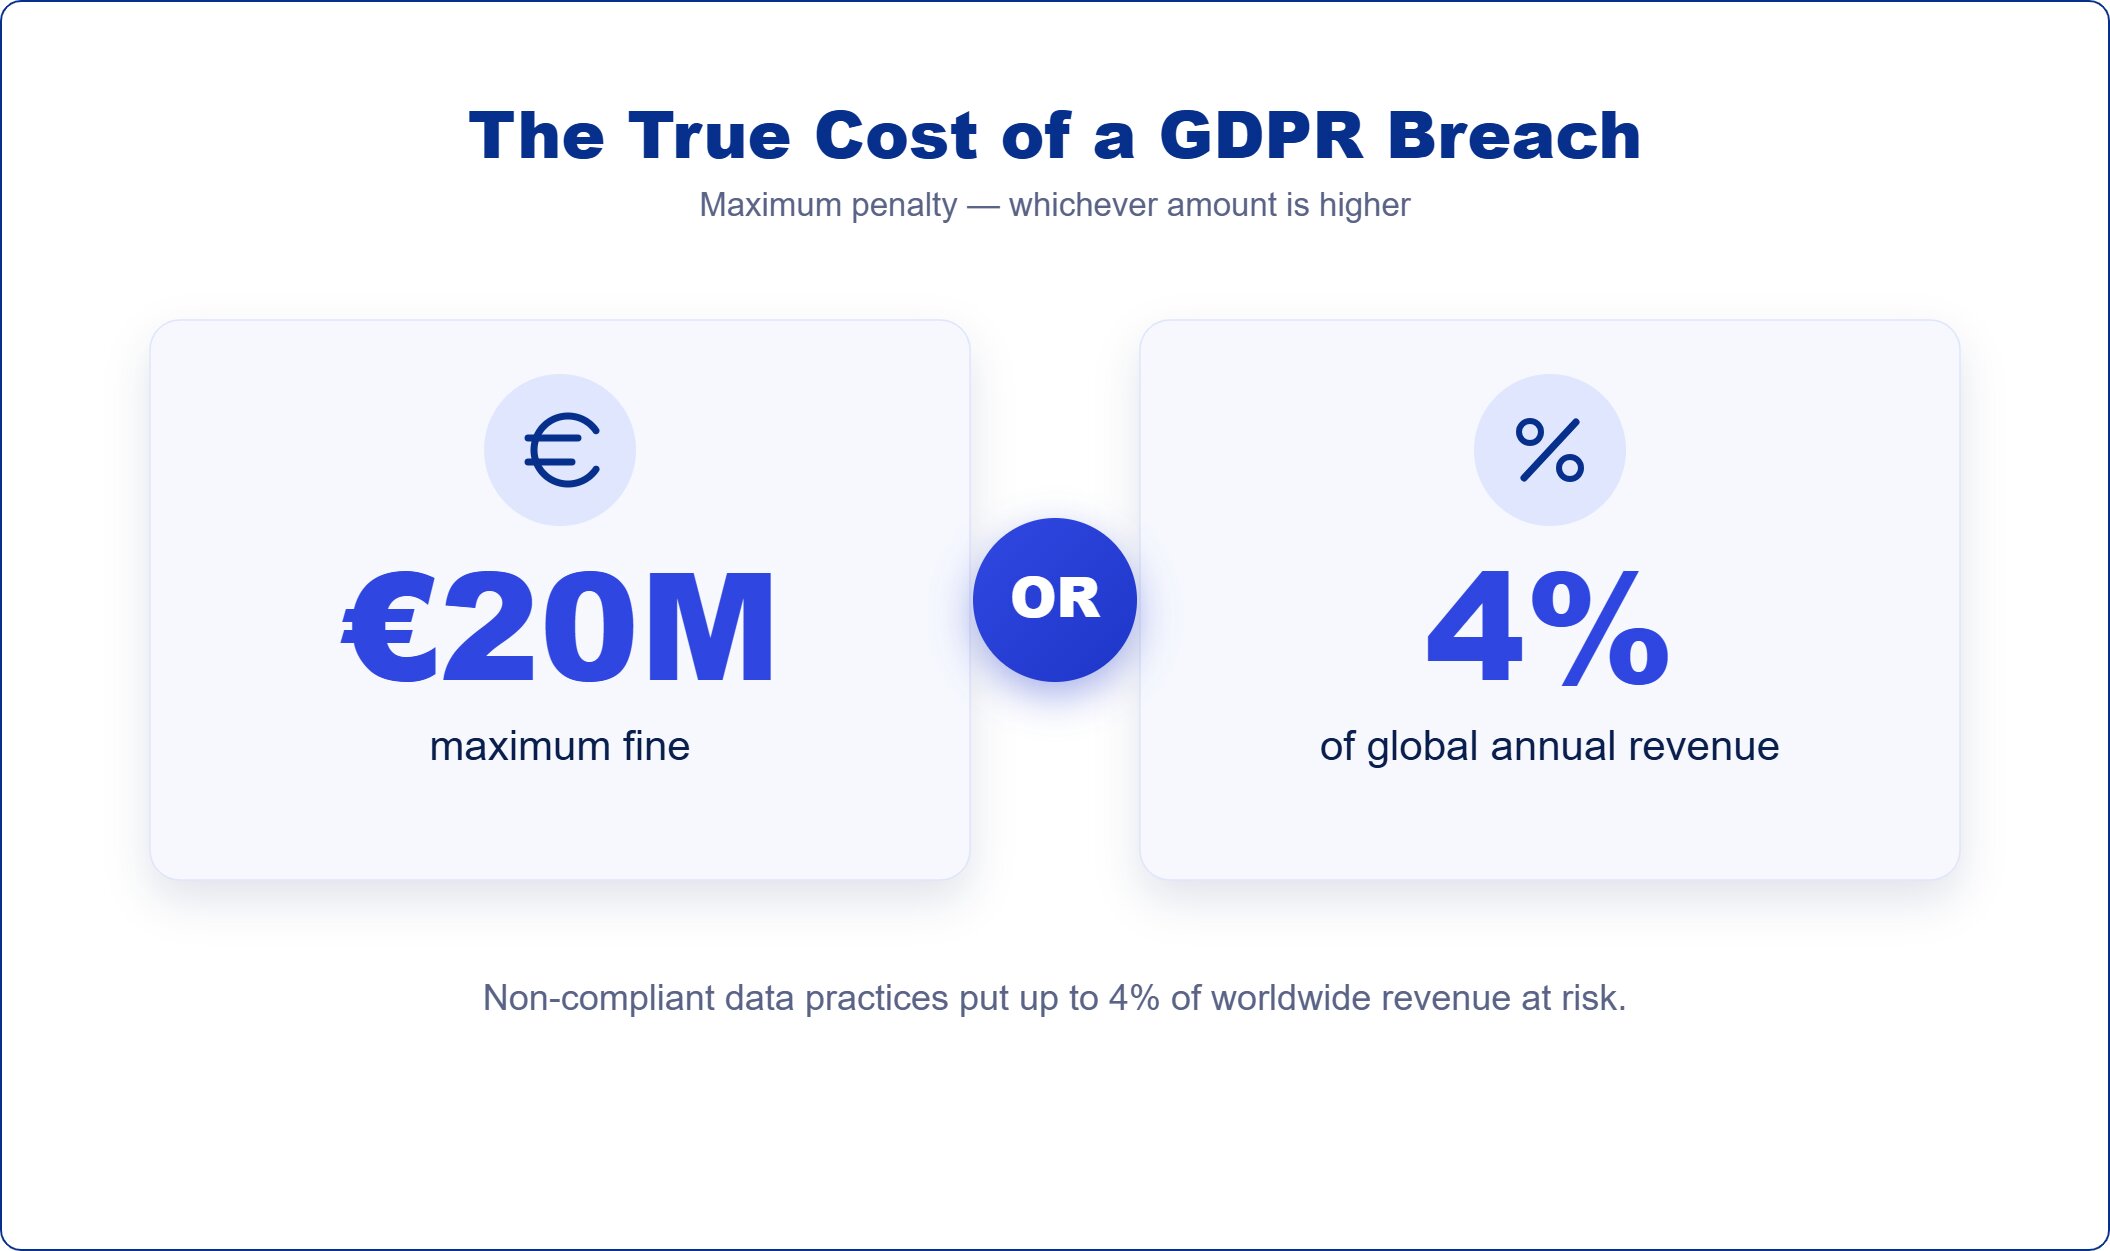
- The penalties for GDPR violations are up to €20 million or 4% of worldwide annual turnover, whichever is greater.
- In 2025 alone, over 330 fines were issued by European authorities, and the notifications for breaches increased by 22% compared to the previous year.
- As of 2026, comprehensive privacy laws existed in 20 states in the U.S., and the B2B exemption of CCPA appears to have come to an end.
Document your legal basis for outreach, cap retention at a sensible window, maintain suppression lists, and train your team on what they can and can’t do with prospect data.
Misaligned sales and marketing definitions of an “ICP account.”
No CMO and VP of Sales can agree on a one-sentence description of a Tier 1 account, and you don’t have an ICP, you have two competing drafts. Write it down, get both teams to sign off, and review it every quarter with new closed-won data.
Treating AI scores as black-box truth.
Predictive scoring can only be effective if reps can understand the reasons behind an account’s score. Otherwise, the trust is either overextended or disregarded, and both are death sentences for adoption. Be transparent about your scoring system, offer overrides, and mandate a one-line reason when a rep chooses not to score a top account. The notes are the feedback loop that keeps the model honest.
The same pattern is found in all 6. When sales teams use the data as a solution rather than a problem, data-driven sales fail. The wins get multiplied if you consider it a better question, one that still requires a human response.
The future of data-driven B2B sales
The concepts of data-driven sales won’t change in the next two years. The one thing that is changing is the amount of work you have to do, the amount your customers will accept, and the number of regulators you’ll be able to process. Instead of your reps opening up to AI, it’s becoming an application alongside them, learning about accounts, drafting follow-ups, and marking up deal risks as they keep going through the conversation. Meanwhile, the volume game has come to an end. Buyers are telling us that they don’t want to hear from anyone who’s not relevant, and their response to spray-and-pray outreach efforts just keeps confirming them right.
Underneath it all, privacy is changing prospecting. There is increasing difficulty in using third-party data defensibly and commercially, and greater reliance on engagement and consented first-party signals. All this does not deviate from the beginning of this guide. It’s the same direction of travel, minus the spray and more signal, more judgment about how data and AI fit together, just harder to ignore.
Better decisions, not more tools
The biggest takeaway from this guide isn’t that you need more tools. It’s that you need better decisions. Data-driven B2B sales works when you stop guessing about which accounts to work, when to engage them, and how to talk to them, and start letting the data you already have answer those questions for you.
So don’t attempt to recreate your movement all in one session. Select a piece this term, and conduct an honest audit. Is it the ICP that your closed won deals align with, or the one you wrote 2 years ago? Do your reps believe your account scores, or do they just ignore them quietly? Do the signals you are paying for really incentivize behavior or just sit in a dashboard? Trouble will be easier if you fix one of those holes. This is how this compounds.
To experience a data-driven motion in action based on fit, intent, and AI-driven insights, schedule a quick demo with the AI Ark. No pitch deck is necessary; we’ll take you through it on your own pipeline.
FAQs About Data-Driven B2B Sales
1. What does “data-driven” mean in B2B sales?
Data-driven B2B sales rely on the principles of using firmographic, technographic, behavioral, and intent data, sometimes in conjunction with AI, to guide the targeting, timing, and personalization of outreach to accounts. Rather than guessing what accounts to target or using static lists, you target accounts with actual signals to help you save your team time.
2. How is data-driven B2B sales different from account-based marketing (ABM)?
ABM is a strategy; it means prioritizing marketing and sales efforts for a select group of high-value accounts. It is powered by a sales operating discipline: data-driven sales. Data-driven sales tells you when they are ready, why they fit, and what signals to act on; and ABM tells you which accounts to focus on. ABM, while very much data-driven, can be done without it, but won’t be nearly as effective.
3. What data do B2B sales teams need most?
Four types are needed to be active simultaneously. Firmographic data (who they are in your ICP), technographic data (what tools they use), behavioral data (how they interact with you), and intent data (if they are in-market now or not). None of the layers works by itself. But the true benefit lies in the ability to view all four in one view that your reps can act upon.
4. Is data-driven B2B sales only for large enterprises?
No. The principles are the same at any size; they just change their appearance. An enterprise stack isn’t essential for smaller teams to be data-driven. You already have a clean CRM, a good enrichment source, and a clear ICP based on your own closed-won data. Add tools to the data you already have.
5. How does AI improve B2B sales decisions?
AI enhances B2B sales decisions by providing account scoring, real-time account buying signals, personalized outreach messages, and forecasting the likelihood of deal closure. It does not take the place of your reps–it takes away the work that is wasting their time–and then the parts of the deal that require judgment are the ones that do: positioning, timing, and relationships.